I have a dataset with 2 parameters, looking like this (I have added density contour plots):
My goal is to separate this sample in 2 subsets like this:
This image comes from QUENCHING OF STAR FORMATION IN SDSS GROUPS:CENTRALS, SATELLITES, AND GALACTIC CONFORMITY, Knobel et. al., The Astrophysical Journal, 800:24 (20pp), 2015 February 1, available here. The separation line has been drawn by eye and is not perfect.
What I need is something like the red line (maximizing distances) in this nice Wikipedia graph:
Unfortunately, all linear classification that seem close to what I'm looking for (SVM, SVC, etc.) are supervised learning.
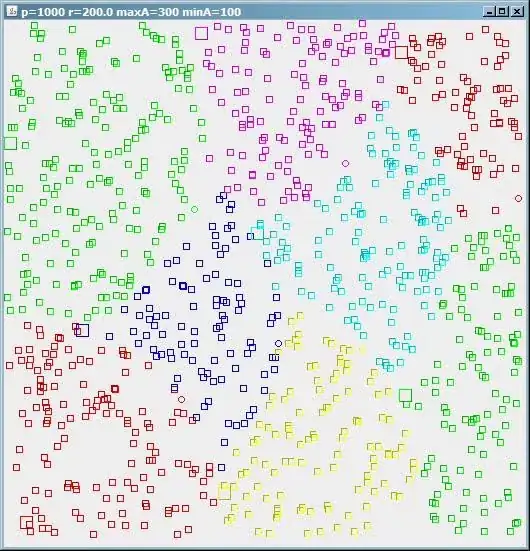
I have tried unsupervised learning, like KMeans 2 clusteers, this way(CompactSFR[['lgm_tot_p50','sSFR']] being the Pandas dataset you can find at the end of this post):
X = CompactSFR[['lgm_tot_p50','sSFR']]
from sklearn.cluster import KMeans

kmeans2 = KMeans(n_clusters=2)
# Fitting the input data
kmeans2 = kmeans2.fit(X)
# Getting the cluster labels
labels2 = kmeans2.predict(X)
# Centroid values
centroids = kmeans2.cluster_centers_
f, (ax1,ax2) = plt.subplots(nrows=1, ncols=2, figsize=(10, 5), sharey=True)
ax1.scatter(CompactSFR['lgm_tot_p50'],CompactSFR['sSFR'],c=labels2);
X2 = kmeans2.transform(X)
ax1.set_title("Kmeans 2 clusters", fontsize=15)
ax1.set_xlabel('$\log_{10}(M)$',fontsize=10) ;
ax1.set_ylabel('sSFR',fontsize=10) ;
f.subplots_adjust(hspace=0)
but the classification I get is this:
Which doesn't work.
Furthermore, what I want is not a simple classification but the equation of the separation line (which is obviously very different from a linear regression).
I would like to avoid developing a Bayesian model of maximum likelihood if something already exists.
You can find a small sample (959 points) here.
NB : this question doesn't correspond to my case.


