26

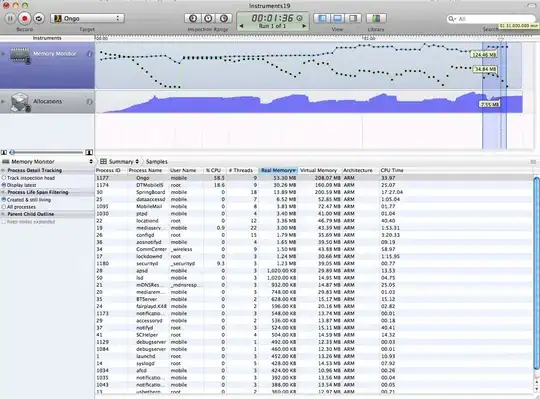
As can been seen in this screen shot from instruments, Allocations thinks my application (Ongo) is only using 7.55 MBs of memory, while Memory Monitor says 53.30. Further more the free system memory has little to no correlation to the amount of memory that the app is using. Does anyone know why there is such a big disagreement between these two tools? Additionally is it possible to find the source of the low system memory or how to keep it from running out so quickly? My app doesn't appear to be leaking memory but somehow it's exhausting the system resources.

Thanks

Instruments Y U Lie?

Brian
  • 772
  • 1
  • 13
  • 31
  • Nobody knows the reason for this? My only guess is that using screen real-estate for images isn't billed to the app in allocations but is in the memory monitor. Does allocations not track the entire process memory usage or is it memory monitor tracking memory not in my process? – Brian Apr 11 '11 at 15:36
  • 1
    isn't the memory monitor tracking the memory for all running application and the allocations tool only for your App? –  Apr 11 '11 at 15:48
  • 1
    @iPortable ofc it is, that's why he's not comparing ALL memory use but only its app... read well question. – Vincent Guerci Apr 11 '11 at 16:02

4 Answers4

31

I believe this is due to the fact that memory usage from OpenGL ES is hidden from ObjectAlloc, but counted in Memory Monitor. For example, see zoul's tests in his question here, where he observes a slight uptick in ObjectAlloc on creation of a texture, but then that memory disappears from that instrument when passed off to OpenGL ES. Memory Monitor still tracks that texture memory.

This should include the visual aspect of UI elements, like layers and views, because CALayers are effectively wrappers for OpenGL ES textures. The actual 2D image representation of your UI elements don't appear to be tracked by ObjectAlloc, which leads to the lower total values in ObjectAlloc.

ObjectAlloc is still good for tracking numbers and types of allocations, and is even more valuable since the advent of the heapshot functionality. You just want to partner it with Memory Monitor to look at your true overall memory usage.

Community
  • 1
  • 1
Brad Larson
  • 170,088
  • 45
  • 397
  • 571
  • 3
    Thanks for the answer Brad. 50pts to Gryffindor. I was hoping for a more definitive answer, maybe pointing to a bit of documentation that I missed, but guess there isn't one to be had. Anyway Zoul's test is interesting. – Brian Apr 17 '11 at 15:47
  • Thanks for your answer Brad, my app is CoreData- and UIWebView-heavy, so I assume I should take a closer look at the latter (Memory Monitor reports that my app is using ~ 100 MB, iPad 1, iOS 5). – Piotr Byzia Feb 09 '12 at 16:13
5

For those who sees this post after the year 2012:

The memory really loaded into device's physical memory is the Resident Memory in VM Tracker Instrument.

Allocation Instrument only marks the memory created by malloc/[NSObject alloc] and some framework buffer, for example, decompressed image bitmap is not included in Allocation Instrument but it always takes most of your memory.

Please Watch WWDC 2012 Session 242 iOS App Performance: Memory to get the information from Apple.

CarmeloS
  • 7,868
  • 8
  • 56
  • 103
  • Video at https://developer.apple.com/videos/play/wwdc2012/242/ for those who are interested. – Rob Apr 22 '19 at 16:37
3

Memory monitor will count most or all resources held by the application, including indirectly allocated ones at the kernel level. This includes AFAIK video memory (textures etc.) as Brad suggested, but also memory mapped files and possibly largish kernel structures such as sockets. The list is probably quite long...

Steven Kramer
  • 8,473
  • 2
  • 37
  • 43
  • Joe, memory monitor is pretty close to the number you are interested in. We have chased after one particular bug for a long time with Apple engineers where memory was lost/not being accounted for in memory monitor, ultimately crashing the app and sometimes the phone! But this was exceedingly rare and never solved. – Steven Kramer Apr 15 '11 at 08:20
0

Any code encapsulated within the braces of a dispatch call to GCD is shielded from two things: error reporting and, sometimes, allocation counting. That usually only applies to CoreFoundation or any other thing non-UIKit or non-NSFoundation.

James Bush
  • 1,485
  • 14
  • 19