I have a loop of 4 graphs with a character list like 'a, b, c, d', so in the title of each graph I want 'a', 'b', 'c' or 'd'. However, when I run my code, 'a' appears in all titles.
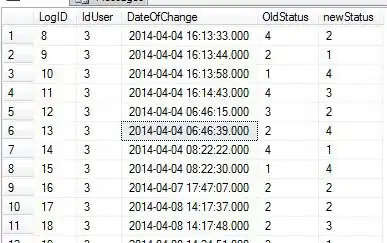
This is the dput of the data I am using.
structure(list(Point = c(5, 6, 7, 8), La = c(535, 565, 532, 587
), Ce = c(45, 46, 58, 43), Pr = c(56, 54, 43, 50), Nd = c(23,
28, 18, 26)), class = c("spec_tbl_df", "tbl_df", "tbl", "data.frame"
), row.names = c(NA, -4L), spec = structure(list(cols = list(
Point = structure(list(), class = c("collector_double", "collector"
)), La = structure(list(), class = c("collector_double",
"collector")), Ce = structure(list(), class = c("collector_double",
"collector")), Pr = structure(list(), class = c("collector_double",
"collector")), Nd = structure(list(), class = c("collector_double",
"collector"))), default = structure(list(), class = c("collector_guess",
"collector")), skip = 1), class = "col_spec"))
and the code I came up so far. ONLY the cols do not cycle through the title. The rest of the code works perfectly. I am still a beginner, so thank you for your time and patience.
acq <- select(X1, La:Nd)

##loop##

gg <- for (ii in acq){
  cols <- names(X1)[2:5]
  m <-mean(ii)
  sds <- sd(ii)
  m1 <- mean(ii)+1
  m2 <-mean(ii)-1

  ##plot##
  g <- ggplot(X1,aes_string(x="Point",y="ii")) +
    ggtitle(paste(cols,"\n",m,"\n",sds,"\n")) +
    theme(plot.title = element_text(hjust = 0.5)) +
    geom_line() + geom_hline(aes(yintercept=mean(ii))) + ylab('') + xlab('')+
    geom_hline(aes(yintercept=m1),linetype=2)  +
    geom_text(x=8,y=m1,label="10%",vjust=-1) +
    geom_hline(aes(yintercept=m2),linetype=2) +
    geom_text(x=8,y=m2,label="10%",vjust=-1)

  print(g)
}
My data:
~Point, ~La, ~Ce, ~Pr, ~Nd,
     5, 535,  45,  56,  23,
     6, 565,  46,  54,  28,
     7, 532,  58,  43,  18,
     8, 587,  43,  50,  26