1

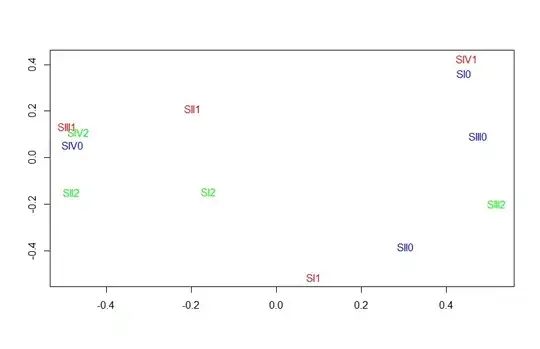
I have plotted point graph using vegan package but I want to circle the similarly treated species. As shown in the figure, 3 colors for 3 treatments. I want to circle them too.

Here is my code.

library(vegan)
library(MASS)
library(readxl)


bray1 <- read_excel("bray1.xlsx")

cols <- c("red", "blue","blue", "green","green","red","blue","green","green","red","red","blue")

row.names(bray1) <- c("SI1", "SII0", "SI0", "SII2", "SI2", "SII1", "SIII0", "SIV2", "SIII2", "SIV1", "SIII1", "SIV0")

bcdist <- vegdist(bray1, "bray")

bcmds <- isoMDS(bcdist, k = 2)


plot(bcmds$points, type = "n", xlab = "", ylab = "")

text(bcmds$points, dimnames(bray1)[[1]],col = cols,size=10)

Here is my current figure.[My data

bray1<-structure(list(`Andropogon virginicus` = c(0, 0, 0, 0, 2.7, 31.5333333333333, 0, 0, 0, 0, 0, 0), `Oenothera parviflora` = c(61.6,30.3333333333333, 7.53333333333333, 0, 11.7333333333333, 0, 0, 0,75.4, 0, 0, 0), `Lespedeza cuneata` = c(0, 0, 0, 0, 0, 46.7333333333333, 0, 0, 3, 0, 0, 0), `Lespedeza pilosa` = c(0, 1.93333333333333, 0,  0, 1.73333333333333, 0, 0, 0, 0, 1.7, 0, 0), `Chamaesyce maculata` = c(0, 0, 0,4.733333333, 0, 0, 0, 0, 0, 0, 0, 0), `Chamaesyce nutans` = c(0,0, 0, 0, 0,0, 0.166666666666667, 0, 0, 0, 0, 0), `Bidens frondosa` = c(0, 0, 0,1.76666666666667, 1.03333333333333, 3.23333333333333, 0, 0, 0, 0, 0, 0), `Erigeron annuus` = c(0, 0, 0, 0, 0.4, 0, 0, 0, 0, 0, 0, 0), `Erigeron canadensis` = c(0, 0, 0, 0, 0, 4.33333333333333, 0, 0, 9.1, 2.066666667, 0,0), `Equisetum arvense` = c(46, 62.7333333333333, 0, 1.66666666666667, 0, 0.533333333333333, 0, 0, 0, 0, 0, 0),     `Erigeron sumatrensis` = c(0, 0, 0, 0, 0, 16.4333333333333,     0, 4, 0, 6.633333333, 0, 0), `Hypochaeris radicata` = c(0,     3.76666666666667, 116.6, 0, 5.033333333, 9.76666666666667,     29, 0, 23.1666666666667, 82.16666667, 0, 0), `Lactuca indica` = c(10.26666667,     0, 1.566666667, 120.1333333, 44.36666667, 42.0333333333333,     0, 14.2333333333333, 0, 0, 14.36666667, 22.2), `Solidago altissima` = c(0,     1.06666666666667, 33.93333333, 0, 0, 0, 0, 0, 0, 6.6, 0,     0), `Sonchus asper` = c(0, 35.9, 0, 0, 0, 7.46666666666667, 
29.6666666666667, 4.96666666666667, 0, 0, 0.23, 2.933333333    )), .Names = c("Andropogon virginicus", "Oenothera parviflora", "Lespedeza cuneata", "Lespedeza pilosa", "Chamaesyce maculata", "Chamaesyce nutans", "Bidens frondosa", "Erigeron annuus", "Erigeron canadensis", "Equisetum arvense", "Erigeron sumatrensis", "Hypochaeris radicata", "Lactuca indica", "Solidago altissima", "Sonchus asper"), row.names = c(NA, -12L), class = c("tbl_df", "tbl", "data.frame"))
Mr Good News
  • 121
  • 1
  • 3
  • 15
  • Can you share `bcmds` data frame only? It's easier for folks to help – Tung Mar 18 '19 at 04:58
  • You can use the [`reprex`](https://reprex.tidyverse.org/articles/articles/magic-reprex.html) and [`datapasta`](https://cran.r-project.org/web/packages/datapasta/vignettes/how-to-datapasta.html) packages to quickly create a reproducible example so others can help. Please do not use `str()`, `head()` or screenshot. See also [Help me Help you](https://speakerdeck.com/jennybc/reprex-help-me-help-you?slide=5) & [How to make a great R reproducible example?](https://stackoverflow.com/q/5963269) – Tung Mar 18 '19 at 04:58
  • You say "I want to circle the similarly treated species", but what determines "similar treatment"? – G5W Mar 18 '19 at 13:01
  • You **must** use `asp = 1` in plots to get equal aspect ratio for ordination graphics (or use `vegan::plot` function for NMDS which does this automatically. Then you should check `?ordiellipse` function in **vegan**: it draws ellipses on graphs. – Jari Oksanen Mar 18 '19 at 14:51
  • @G5W Sorry for the confusion. I have represented them with colors in the graph and the code. There are three teatments S0, S1 and S2. The roman letter is just replication number. – Mr Good News Mar 18 '19 at 23:49

1 Answers1

1

Here are a couple of alternatives based on the dataEllipse function in the car package. I have made a few minor alterations to your base graph. I found it hard to read the pure "green" color text, so I switched it to "darkgreen". I changed the plotting limits so that the full ellipses would be in the picture. Also, your text statement included an argument size. text does not have an argument size so I replaced it with cex to set the font size.

library(car)

Group = c(1,2,2,3,3,1,2,3,3,1,1,2)
cols <- c("red", "blue","blue", "darkgreen","darkgreen","red","blue",
    "darkgreen","darkgreen","red","red","blue")

In the first version, I did what I think you asked for, ellipses marking the treatment groups.

plot(bcmds$points, type = "n", xlab = "", ylab = "", 
    xlim=c(-0.8,0.8), ylim=c(-0.8,0.8), asp=1)
text(bcmds$points, dimnames(bray1)[[1]],col = cols, cex=0.8)
dataEllipse(bcmds$points[,1], bcmds$points[,2], factor(Group),
    plot.points=F, add=T, col=c("red", "blue", "green"),
    levels=rep(0.6, 3), center.pch=0, group.labels="", lwd=1)

Ellipses by outline

In the second version, instead of using the outline of the ellipse, I use a transparent fill color to show the ellipses.

plot(bcmds$points, type = "n", xlab = "", ylab = "", 
    xlim=c(-0.8,0.8), ylim=c(-0.8,0.8), asp=1)
text(bcmds$points, dimnames(bray1)[[1]],col = cols, cex=0.8)
dataEllipse(bcmds$points[,1], bcmds$points[,2], factor(Group),
    plot.points=F, add=T, col=c("red", "blue", "green"),
    levels=rep(0.6, 3), center.pch=0, group.labels="", 
    lty=0, fill=TRUE, fill.alpha=0.04)

Ellipses filled with transparent color

G5W
  • 36,531
  • 10
  • 47
  • 80
  • Thank you very much for your time. How did you mark the treatment with group? Did you create a separate column for treatment in the data file? – Mr Good News Mar 19 '19 at 01:46
  • Sorry that I left that out of the answer. I will edit it in. Yes, I created a variable for the group – G5W Mar 19 '19 at 01:50