I'm developing an application in c++ with Qt and Qwt framework for scientific plots. I have matrix data stored as cv::Mat, representing an image with scalar data (MxN), which needs to be visualized as a colormap.
With OpenCV it is performed using cv::applyColorMap(img,cm_img,cv::COLORMAP_JET) and cv::imshow("img name", img), as described here
I have tried converting cv::Mat to QImage, as described here and here but it seems not to be working properly. When I try to show the resulting images, it doesn't make sense.
From Qwt, there are some classes that looks interesting for that matter: QwtMatrixRasterData, QwtPlotSpectrogram or QwtPlotRasterItem.
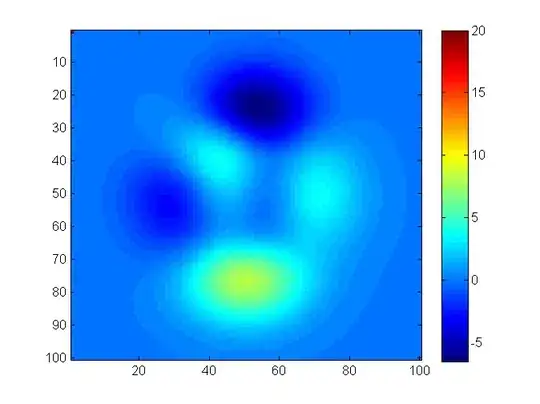
What I need as final output would be something like this. Given a matrix (MxN) with double values, calling something like imshow I get an colormap image like this