So, Google charts API is getting deprecated soon, and we're migrating from it into chartkick + chart.js.
I've just joined the project, in a change of development team, so I'm fairly new to it, which makes matters even more complicated.
Anyway, I've encountered some problems in keeping the same style as the old graphs while using Chart.js, for instance:
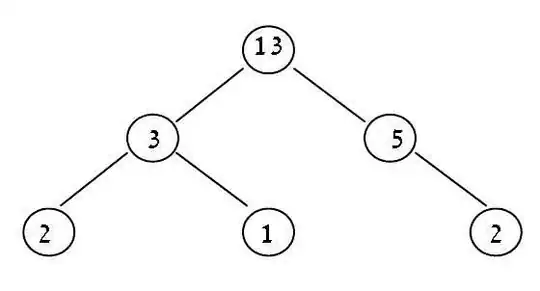
The old graphs (check images bellow, for more context) haves some elements that are essential, according to the client, that I just can't replicate:
- two V axis labels, one above, and one bellow.
- unstacked values for X axis (e.g., if there are two '1' values for the x Axis, they end up stacking, which I do not want)
- unordered X axis
- custom tick lines, and tick lines width
- custom borders (the grey lines at the top, and at the bottom)
- vertical grids
I've tried using several options from Chart.js, including ticks:, gridlines, and stacked: false, in several different configurations, but so far, no dice.
This is the current code I'm using (including some data McGyverism) to display the charts:
    line_chart data,
      library: {
                 showLines: true,
                 tooltips: { enabled: false },
                 title: {
                   display: true,
                   text: graph_title(graph_number, type),
                   fontSize: 11
                 },
                 scales: {
                  yAxes: [{
                    ticks: {
                      display: false,
                      stepSize: steps,
                    }
                  }],
                  xAxes: [{
                    ticks: {
                      display: ticks,
                      fontSize: 9,
                      fontStyle: 'bold'
                    }
                  }]
                 }
               }
The data McGyverism mentioned, it for the labels being displayed, to circumvent the stacking/ problem:
["D: #{label_value}": calculated_value],
["I: #{label_value}": calculated_value]...
If it helps, here's the old API call parameters:
Being d2, i2, s2 and c2 the label values, and d, i, s, c the actual graph points (there's some calculation being done with the labels before displaying them)
chart?
&chxl=0:||#{d2}|#{i2}|#{s2}|#{c2}||1:||D|I|S|C|
&chxr=2,0,220&chxs=0,000000,13.5,0,l|1,000000,13.5,0,l|2,676767,10,0,lt
&chxt=x,t
&chf=bg,s,00000000|c,ls,90,CCCCCC,0.05,FFFFFF,0.90,CCCCCC,0.05
&chs=#{size}&cht=lxy
&chco=000000&chds=0,5,0,220
&chdlp=b&chls=3&chma=10,25,10,25
&chg=20,0,0
&chm=o,000000,0,-1,10|h,CCCCCC,0,0.5,3,-1|h,CCCCCC,0,0.41,1,-1|h,CCCCCC,0,0.59,1,-1
&chts=000000,10
&chtt=#{title}
&chd=t:1,2,3,4|#{d},#{i},#{s},#{c}"
This is what the client wants:
This is what I got so far:
To summarize:
Is it possible to achieve such a thing using Chart.js + Chartkick? If so, how? And if not, what are my alternatives?