13

I am doing a vlines plot in matplotlib and I have all my y values in the dataset as >=0. I want my y axis bottom most tick to read 0, but instead, I get -500.

Here is the code:

#!/usr/bin/env python

import numpy as np
from matplotlib import pyplot as plt, dates as mdates
import datetime as dt, time

# Read the data and turn it into a numpy array
#store = map(lambda line: map(int, line.strip().split()), open(name + '.txt').readlines())
store = [
    [1293606162197, 0, 0],
    [1293605477994, 63, 0],
    [1293605478057, 0, 0],
    [1293605478072, 2735, 1249],
    [1293606162213, 0, 0],
    [1293606162229, 0, 0],
]

nstore = np.array(store)

# Get arrays of each columns in the store array
d = nstore[:,0]
y1 = nstore[:,1]
y2 = nstore[:,2]

# Get arrays of values to be passed to matplotlib
s = d / 1000
dts = map(dt.datetime.fromtimestamp, s)
fds = mdates.date2num(dts)

# new figure and subplot
fig = plt.figure()
ax = fig.add_subplot(111)

# Plot using vlines
ax.vlines(fds, [0], y1, 'red')

# set xaxis tick settings
ax.xaxis.set_major_locator(mdates.MinuteLocator())
ax.xaxis.set_major_formatter(mdates.DateFormatter('%m/%d %H:%M'))

for label in ax.xaxis.get_ticklabels():
    label.set_rotation('vertical')

fig.subplots_adjust(bottom=.25)

# Set the y axis bottom limit to 0
ax.set_ylim(bottom=0)   # <<- THIS DOES NOT SEEM TO BE WORKING

# Save the plot figure
fig.savefig('out.png')

and here is the plot I get: enter image description here

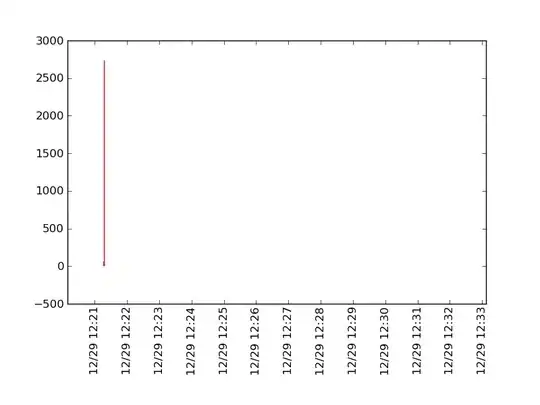
Can anyone point to me what I am doing wrong? Also, if you can point me to the docs that have the details I need, that would be great. Thanks.

Question is a follow up of Creating graph with date and time in axis labels with matplotlib

Community
  • 1
  • 1
sharat87
  • 7,330
  • 12
  • 55
  • 80

1 Answers1

24

You can set the limit manually after plotting the data, like so:

pyplot.ylim(ymin=0)

What happens is that Matplotlib adjusts the plot limits so that it looks "best". Sometimes, this implies going beyond the strict range of your data. You must then update the limits after the plot, since each plot updates the limit (if I understand correctly).

Now, your approach can work, but you must update the figure after setting the limits:

ax.set_ylim(bottom=0)
pylot.draw()

(This works in the IPython shell on Mac OS X with the latest version of matplotlib.)

Eric O. Lebigot
  • 91,433
  • 48
  • 218
  • 260
  • ah, thanks EOL, that gets it working. Is there an equivalent of this method in an object oriented style, as I will be doing many plots in parallel. – sharat87 Apr 05 '11 at 06:54
  • @Shrikant: I added an object-oriented approach to my answer. – Eric O. Lebigot Apr 05 '11 at 06:58
  • I get a `TypeError: draw_wrapper() takes at least 2 arguments (1 given)` with `ax.draw()`, running on Ubuntu. – sharat87 Apr 05 '11 at 07:15
  • @Shrikant: Sorry; I updated the answer with the correct call to `draw()`. – Eric O. Lebigot Apr 05 '11 at 07:19
  • 1
    Oh boy! I got it figured, changing `ax.set_ylim(bottom=0)` to `ax.set_ylim(ymin=0)` works like a charm, without the need for a call to `.draw()`. Thanks – sharat87 Apr 05 '11 at 07:19
  • right, my `matplotlib.__version__` spits out `0.99.3`, the latest version on the website seems to be `1.0.1`, damn ubuntu repos! – sharat87 Apr 05 '11 at 07:22
  • @Shrikant: Interesting but strange: `ax.set_ylim(ymin=…)` does not update the graph on my Mac OS X (through IPython) and `pyplot.draw()` is stil needed, like with `bottom=…`. It may therefore be better to consistently use portable code and include the `draw()`. :) – Eric O. Lebigot Apr 05 '11 at 07:24
  • 1
    For the record: `ax.set_ylim(ymin=…)` is old syntax and is obsoleted by the `bottom=…` of the answer. – Eric O. Lebigot Jan 19 '15 at 12:37