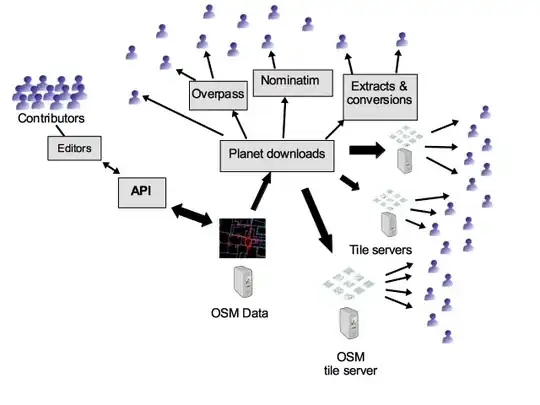
I occasionally see diagrams where two 2-dimensional scatterplots are superimposed on one another in a 3D space so that corresponding points can be linked. Frequently these take the form of networks where the two networks overlayed. For example:
 reference: https://satijalab.org/seurat/v3.0/pbmc3k_tutorial.html
 reference: https://image.slidesharecdn.com/2007mauricioarango-end-to-endqosviaoverlaynetworksandbandwidthon-demand-091102230540-phpapp02/95/providing-endtoend-network-qos-via-overlay-networks-and-bandwidth-ondemand-mauricio-arango-2007-5-728.jpg?cb=1257203157
I know I could arbitrarily add a common 3rd dimension to two dimensional plots to get a plot like this:
from mpl_toolkits.mplot3d import Axes3D
import matplotlib.pyplot as plt
import numpy as np

def randrange(n, vmin, vmax):
    return (vmax - vmin)*np.random.rand(n) + vmin

n = 100

fig = plt.figure()
ax = fig.add_subplot(111, projection='3d')

xs = randrange(n, 23, 32)
ys = randrange(n, 0, 100)
zs = np.append(np.repeat(1, 50), np.repeat(2, 50))

for c, m in [('r', 'o'), ('b', '^')]:
     ax.scatter(xs, ys, zs, c=c, marker = m)
and then connect the relevant points but I thought there might be a more straightforward way to construct such images in either R or python?

