2

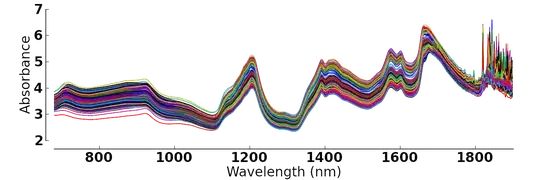
I'm having multiple data frames where the first column (in the end filled with NA's) is the wavenumber and the other columns are my variables of the specific wavenumber for multiple observations.

Is there a possibility to plot the columns in a way that my first column holds the variables for the x-axis and the other are plotted into one big plot with their respective y-values?

I already tried "matplot" (resulting in "numbers" instead of points),

matplot(df[,1],df[,3:5],xlab = "Wavelength [nm]", ylab = "Absorbance")

different sets of "xyplot" (no possibility to give more than one y-value), but none seem to work (on my level of knowledge on R).

The final result should look like this:

this

Thanks for any help!

Capt.Krusty
  • 597
  • 1
  • 7
  • 26
  • You could try to reshape your data to long format as described [here](https://stackoverflow.com/questions/2185252/reshaping-data-frame-from-wide-to-long-format) and then use the ggplot2-package. To get more detailed helpt on this please post some sample data. Type `dput(df)` in your console; this will output the data as text that you can post here. – Simon Apr 10 '19 at 14:31

2 Answers2

2

You could always make your own function to do this ;I make such functions on a regular basis when nothing really fits my needs. I put this together rather quickly but you can adapt it to your needs.

# generate data
set.seed(6)
n <- 50
dat <- data.frame(x1=seq(1,100, length.out = n), 
                  x2=seq(1,20, length.out = n)+rnorm(n),
                  x3=seq(1,20, length.out = n)+rnorm(n, mean = 3),
                  x4=seq(1,20, length.out = n)+rnorm(n, mean = 5))
# make some NAs at the end
dat[45:n,2] <- NA
dat[30:n,3] <- NA


plot_multi <- function(df, x=1, y=2, cols=y,
                       xlim=range(df[,x], na.rm = T),
                       ylim=range(df[,y], na.rm = T),
                       main="", xlab="", ylab="", ...){
  # setup plot frame
  plot(NULL, 
       xlim=xlim, 
       ylim=ylim,
       main=main, xlab=xlab, ylab=ylab)

  # plot all your y's against your x
  pb <- sapply(seq_along(y), function(i){
    points(df[,c(x, y[i])], col=cols[i], ...)
  })
}

plot_multi(dat, y=2:4, type='l', lwd=3, main = ":)",
           xlab = "Wavelength", ylab = "Absorbance")

Results in :

A plot

EDIT

I actually found your dataset online by chance, so I'll include how to plot it as well using my code above.

file <- 'http://openmv.net/file/tablet-spectra.csv'
spectra <- read.csv(file, header = FALSE)

# remove box label
spectra <- spectra[,-1] 

# add the 'wavelength' and rotate the df
# (i didn't find the actual wavelength values, but hey).
spectra <- cbind(1:ncol(spectra), t(spectra)) 

plot_multi(spectra, y=2:ncol(spectra), cols = rainbow(ncol(spectra)),
           type='l', main=":))", ylab="Absorbance", xlab = "'Wavelength'")


Another plot

RoB
  • 1,833
  • 11
  • 23
  • Thanks, that was exactly what I needed! Take my upvote Sir! Short additional question: how can i change the values of the individual axis so that i could "zoom" into specific intervals in the plot? How do i have to change your function for this? Thank you very much once again! – Capt.Krusty Apr 23 '19 at 10:44
  • 1
    No problem, you can just subselect the rows of your data frame according to the part you want to plot. For example, if you want to plot the values from *indices* (not wavelengths) 100 to 200, you can give `spectra[100:200, ]` to the function and it will work fine. I'll let you figure out how to get the indices corresponding to a wavelength span. – RoB Apr 23 '19 at 10:51
  • I got it for the x-axis, but I meant for the y-axis too, like in your edited plot: how can i fix the y-axis setting at, let's say, "3-5 absorbance", even if the data exceeds "5 absorbance" in "400-600 wavelength"? I hope I could explain what i mean ;) – Capt.Krusty Apr 23 '19 at 11:40
  • 1
    Ah, I updated my answer so that the function takes xlim and ylim as parameters. You can specify the ranges you want through these (as values, not indices this time). Set `ylim=c(3,5), xlim=c(400,600)` for your example. – RoB Apr 23 '19 at 11:57
  • Works perfectly! Thanks once again! – Capt.Krusty Apr 23 '19 at 13:46
1

You could use the pavo R package, which is made to deal with spectral data (full disclosure, I'm one of the maintainers):

library(pavo)

df <- t(read.csv("http://openmv.net/file/tablet-spectra.csv", header = FALSE))
df <- df[-1, ]
df <- apply(df, 2, as.numeric)
df <- cbind(wl = seq_len(nrow(df)),
            df)

df <- as.rspec(df)
#> wavelengths found in column 1

plot(df, ylab = "Absorbance", col = rainbow(3))

Created on 2019-07-26 by the reprex package (v0.3.0)

Droplet
  • 935
  • 9
  • 12