8

For the question "Ellipse around the data in MATLAB", in the answer given by Amro, he says the following:

"If you want the ellipse to represent a specific level of standard deviation, the correct way of doing is by scaling the covariance matrix"

and the code to scale it was given as

STD = 2;                     %# 2 standard deviations
conf = 2*normcdf(STD)-1;     %# covers around 95% of population
scale = chi2inv(conf,2);     %# inverse chi-squared with dof=#dimensions

Cov = cov(X0) * scale;
[V D] = eig(Cov);

I don't understand the first 3 lines of the above code snippet. How is the scale calculated by chi2inv(conf,2), and what is the rationale behind multiplying it with the covariace matrix?

Additional Question:

I also found that if I scale it with 1.5 STD, i.e. 86% tiles, the ellipse can cover all of the points, my points set are clumping together, at almost all the cases. On the other hand, if I scale it with 3 STD, i.e. 99%tiles, the ellipse is far too big. Then how can I choose a STD to just tightly cover the clumping points?

Here is an example:

The inner ellipse corresponds to 1.5 STD and outer to 2.5 STD. why 1.5 STD is tightly cover the clumping white points? Is there any approach or reason to define it?

enter image description here

Community
  • 1
  • 1
Cheung
  • 373
  • 6
  • 15

1 Answers1

12

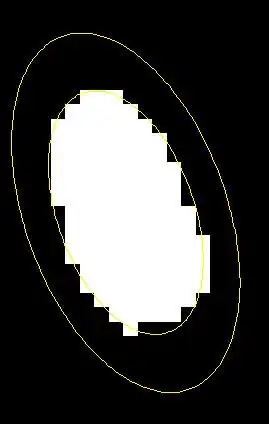
The objective of displaying an ellipse around the data points is to show the confidence interval, or in other words, "how much of the data is within a certain standard deviation way from the mean"

In the above code, he has chosen to display an ellipse that covers 95% of the data points. For a normal distribution, ~67% of the data is 1 s.d. away from the mean, ~95% within 2 s.d. and ~99% within 3 s.d. (the numbers are off the top of my head, but you can easily verify this by calculating the area under the curve). Hence, the value STD=2; You'll find that conf is approx 0.95.

The distance of the data points from the centroid of the data goes something like (xi^2+yi^2)^0.5, ignoring coefficients. Sums of squares of random variables follow a chi-square distribution and hence to get the corresponding 95 percentile, he uses the inverse chi-square function, with d.o.f. 2, as there are two variables.

Lastly, the rationale behind multiplying the scaling constant follows from the fact that for a square matrix A with eigenvalues a1,...,an, the eigenvalues of a matrix kA, where k is a scalar is simply ka1,...,kan. The eigenvalues give the corresponding lengths of the major/minor axis of the ellipse, and so scaling the ellipse or the eigenvalues to the 95%tile is equivalent to multiplying the covariance matrix with the scaling factor.

EDIT

Cheng, although you might already know this, I suggest that you also read this answer to a question on randomness. Consider a Gaussian random variable with zero mean, unit variance. The PDF of a collection of such random variables looks like this

enter image description here

Now, if I were to take two such collections of random variables, square them separately and add them to form a single collection of a new random variable, its distribution looks like this

enter image description here

This is the chi-square distribution with 2 degrees of freedom (since we added two collections).

The equation of the ellipse in the above code can be written as x^2/a^2 +y^2/b^2=k, where x,y are the two random variables, a and b are the major/minor axes, and k is some scaling constant that we need to figure out. As you can see, the above can be interpreted as squaring and adding two collections of Gaussian random variables, and we just saw above what its distribution looks like. So, we can say that k is a random variable that is chi-square distributed with 2 degrees of freedom.

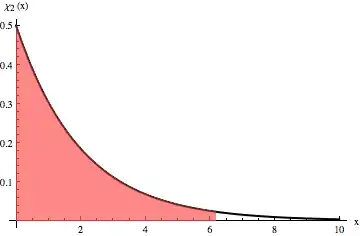
Now all that needs to be done is to find a value for k such that 95%ile of the data is within it. Just like the 1s.d, 2s.d, 3s.d. percentiles that we're familiar with Gaussians, the 95%tile for chi-square with 2 degrees of freedom is around 6.18. This is what Amro obtains from the chi2inv function. He could have just as well written scale=chi2inv(0.95,2) and it would have been the same. It's just that talking in terms of n s.d. away from the mean is intuitive.

Just to illustrate, here's a PDF of the chi-square distribution above, with 95% of the area < some x shaded in red. This x is ~6.18.

enter image description here

Hope this helped.

Community
  • 1
  • 1
abcd
  • 41,765
  • 7
  • 81
  • 98
  • I want to vote you answer but I am a new guy here and don't have engouh reputation. I will vote it later when I have enough reputation. Thank you again. – Cheung Apr 06 '11 at 20:30
  • Hi R. M., I still don't understand why the output of the inverse chi-square function can be the scaling factor. The output of the inverse chi-square function is 6.1801 for STD=2. I am curious about the meaning behind this 6.1801. I think we can cal. the original eigenvalues then scale it by multiplying sqrt(6.1801). I know that we must scale the eigenvalues but I really want to know how to decide the scaling factor. And why we can decide it in this way. Thanks. – Cheung Apr 06 '11 at 22:36
  • Thank you R.M. You must a statist and a good educator, I am weak in this. Your answer is awsome. – Cheung Apr 07 '11 at 16:16
  • I'm sorry, I don't understand your question... did you mean if you can draw the ellipse without scaling? If so, yeah. That's what you get when you plot Amro's original answer without the scaling. – abcd Apr 07 '11 at 16:40
  • Sorry, I have an additinal question need to be varify. Does that mean if we do not consider the scaling constant k, by directly fit the ellipse as it is by: Cov = cov(X0); [V D] = eig(Cov); then the percentile we can cover by the ellipse is only 39.35%tile, because 0.3935=chi2cdf(1,2) with the k=1 without scaling? Thanks. – Cheung Apr 07 '11 at 16:42
  • Hi R.M. I edited the question again maybe you can understand it right now. I also found that if I scale it with 1.5 STD, i.e. 86% tiles, the ellipse can cover all of the points, my points set are clumping together, at almost all the cases. Do I expect it to cover just 86% of the points? Or do I misunderstanding of the 86%tiles? On the other hand, if I scale it with 3 STD, i.e. 99%tiles, the ellipse is far too big. Thanks. – Cheung Apr 07 '11 at 17:55
  • @Cheng: It doesn't mean it covers 86% of the points... It means it covers all points from the center outward till where the area is 86% of the total. Look at it this way... if you had one point that was far outside the cloud, your ellipse is going to expand accordingly, to accommodate the outlier. To see this, enter `X(end,1)=15;X(end,2)=5; X(end-1,1)=1 ;X(end-1,2)=6;` after generating `X` in the code, and set `STD=1`. You'll find that in this case, for the second cloud (cyan), even though the level is set at 67%tile, approx 95% of the points are covered. Outliers make a difference. – abcd Apr 07 '11 at 18:13
  • Thank you. I totally misunderstand it. I think I need to read more about these notation. – Cheung Apr 07 '11 at 18:26
  • I'm also a fan of the great statist! ;) – Benjamin Apr 07 '11 at 18:39
  • Additional Qs are edited and new figure is added. The Additional Qs is then how can I choose a STD to just tightly cover the clumping points? Thanks. – Cheung Apr 07 '11 at 18:56
  • @Cheng: Is your data Gaussian? If not, using the chi-square will not give you the correct result. My guess is that's what's happening. Do you know the distribution of your data? – abcd Apr 07 '11 at 19:09
  • Sorry R.M. I don't konw the distribution of my data. I just know they like the small stones all clumping together, like the figure shows all white points constitute an solid object. Maybe that is the problem~~~ Is there any way to know the distribution of my data? Can I assume they are gaussian? – Cheung Apr 07 '11 at 19:19
  • 1
    Well, you can't really assume they're Gaussian without knowing the statistics of the process that generated those points. To me, it looks like you're just trying to fit an ellipse around an object, similar to a question earlier today on fitting rectangles around objects. This would fall under image processing and detection, and I believe you're using the wrong approach for it. I recommend starting a new question with the specific question you have and tag it image-processing, so that people who are more knowledgable in those fields will see your question and possibly answer it. – abcd Apr 08 '11 at 00:05