0

According to the documentation, you can Set the chart-specific events you want to listen to and the corresponding callback. The example is given uses select which works fine (I've setup an example here. The problem comes when I try to use any other chart type.

From the google charts documentation, for a bar chart, I should be able to use a click event: Screen Shot 2019-04-19 at 10 30 25 AM

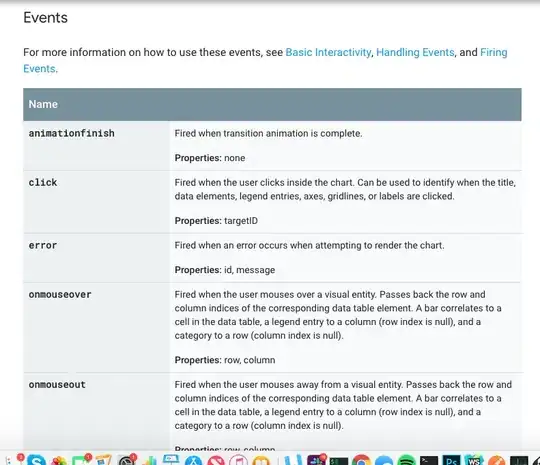
When I add a click event like so:

  {
    eventName: "click",
    callback({}) {
      console.log("clicked");
    }
  }

Nothing happens, but the select event still works. I've setup a code sandbox here to demonstrate this behavior. This also happens for animationfinish, onmouseover, and every other event I've checked.

Jake Sylvestre
  • 936
  • 3
  • 14
  • 39

3 Answers3

5

Looks like rakannimer already answered this in #263 on the GitHub repository, but figured I'd answer this anyway in case anyone else was having this issue.

As this stack overflow answer does a great job of explaining, the ready event must be fired before chart events (like those in the screenshot) can be triggered. Therefore, if you want to use any other event, you have to initiate them in a callback like this:

<Chart
  chartType="ScatterChart"
  width="80%"
  height="400px"
  data={data}
  options={options}
  legendToggle
  chartEvents={[
    {
      eventName: "ready",
      callback: ({ chartWrapper, google }) => {
        const chart = chartWrapper.getChart();
        google.visualization.events.addListener(chart, "onmouseover", e => {
          const { row, column } = e;
          console.warn("MOUSE OVER ", { row, column });
        });
        google.visualization.events.addListener(chart, "onmouseout", e => {
          const { row, column } = e;
          console.warn("MOUSE OUT ", { row, column });
        });
      }
    }
  ]}
/>
Jake Sylvestre
  • 936
  • 3
  • 14
  • 39
  • If there is a chance your chart will be 'ready' more than one time, be sure you avoid adding the mouse event listeners more than one time. – dlaliberte Apr 19 '19 at 22:03
  • 1
    This is not working while adding click event. any suggestion? – Sonu Jun 11 '19 at 10:24
  • @jakeSylvestre coud you please help me out on how I can attach click eb=vent to my horizontal labels https://stackoverflow.com/questions/60629886/how-to-make-react-google-chart-label-clickable –  Mar 11 '20 at 06:48
  • Hey please help me out if you can –  Mar 12 '20 at 10:36
2

Please check below code snippet for adding click event:

import * as React from "react";
import { Chart } from "react-google-charts";

const chartEvents = [
      {
        callback: ({ chartWrapper, google }) => {
          const chart = chartWrapper.getChart();
          chart.container.addEventListener("click", (ev) => console.log(ev))
        },
        eventName: "ready"
      }
    ];

const data = [
  ["age", "weight"],
  [8, 12],
  [4, 5.5],
  [11, 14],
  [4, 5],
  [3, 3.5],
  [6.5, 7]
];

const options = {
  title: "Age vs. Weight comparison",
  hAxis: { title: "Age", viewWindow: { min: 0, max: 15 } },
  vAxis: { title: "Weight", viewWindow: { min: 0, max: 15 } },
  legend: "none"
};
const ExampleChart = () => {
  return (
    <Chart
      chartType="ScatterChart"
      data={data}
      options={options}
      graphID="ScatterChart"
      width="100%"
      height="400px"
      chartEvents={chartEvents}
    />
  );
};

export default ExampleChart;
Sagar
  • 139
  • 4
  • `chart.container` doesn't compile; there is no `container` on `chart` ; version "react-google-charts": "^4.0.0" – YanivGK Feb 06 '23 at 03:25
1

In addition to the solution provided by @jake, the chartWrapper is no more available in the callback event. In my case, replacing it with wrapper works. Like

<Chart
  chartType="ScatterChart"
  width="80%"
  height="400px"
  data={data}
  options={options}
  legendToggle
  chartEvents={[
    {
      eventName: "ready",
      callback: ({ wrapper, google }) => {
        const chart = wrapper.getChart();
        google.visualization.events.addListener(chart, "onmouseover", e => {
          const { row, column } = e;
          console.warn("MOUSE OVER ", { row, column });
        });
        google.visualization.events.addListener(chart, "onmouseout", e => {
          const { row, column } = e;
          console.warn("MOUSE OUT ", { row, column });
        });
      }
    }
  ]}
/>```
YanivGK
  • 893
  • 12
  • 18