11

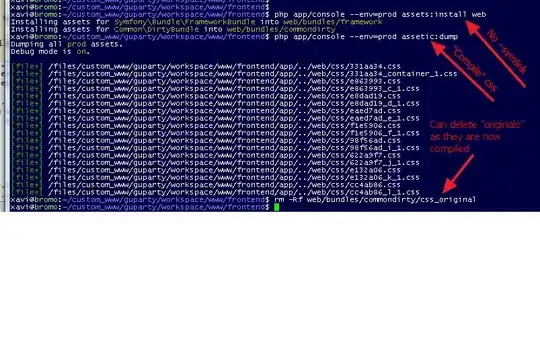
I am trying to plot an outline (linestyle=":") on the networkx edges. I can't seem to figure out how to do this to the matplotlib patch objects? Does anyone now how to manipulate these patch object to plot outlines to these "edges"? If this is not possible, does anyone know how to get the line data to use ax.plot(x,y,linestyle=":") separately to do this?

import networkx as nx
import numpy as np
from collections import *

# Graph data
G = {'y1': OrderedDict([('y2', OrderedDict([('weight', 0.8688325076457851)])), (1, OrderedDict([('weight', 0.13116749235421485)]))]), 'y2': OrderedDict([('y3', OrderedDict([('weight', 0.29660515972204304)])), ('y4', OrderedDict([('weight', 0.703394840277957)]))]), 'y3': OrderedDict([(4, OrderedDict([('weight', 0.2858185316736193)])), ('y5', OrderedDict([('weight', 0.7141814683263807)]))]), 4: OrderedDict(), 'input': OrderedDict([('y1', OrderedDict([('weight', 1.0)]))]), 'y4': OrderedDict([(3, OrderedDict([('weight', 0.27847763084646443)])), (5, OrderedDict([('weight', 0.7215223691535356)]))]), 3: OrderedDict(), 5: OrderedDict(), 'y5': OrderedDict([(6, OrderedDict([('weight', 0.5733512797415756)])), (2, OrderedDict([('weight', 0.4266487202584244)]))]), 6: OrderedDict(), 1: OrderedDict(), 2: OrderedDict()}
G = nx.from_dict_of_dicts(G)
G_scaffold = {'input': OrderedDict([('y1', OrderedDict())]), 'y1': OrderedDict([('y2', OrderedDict()), (1, OrderedDict())]), 'y2': OrderedDict([('y3', OrderedDict()), ('y4', OrderedDict())]), 1: OrderedDict(), 'y3': OrderedDict([(4, OrderedDict()), ('y5', OrderedDict())]), 'y4': OrderedDict([(3, OrderedDict()), (5, OrderedDict())]), 4: OrderedDict(), 'y5': OrderedDict([(6, OrderedDict()), (2, OrderedDict())]), 3: OrderedDict(), 5: OrderedDict(), 6: OrderedDict(), 2: OrderedDict()}
G_scaffold = nx.from_dict_of_dicts(G_scaffold)
G_sem = {'y1': OrderedDict([('y2', OrderedDict([('weight', 0.046032370518141796)])), (1, OrderedDict([('weight', 0.046032370518141796)]))]), 'y2': OrderedDict([('y3', OrderedDict([('weight', 0.08764771571290508)])), ('y4', OrderedDict([('weight', 0.08764771571290508)]))]), 'y3': OrderedDict([(4, OrderedDict([('weight', 0.06045928834718992)])), ('y5', OrderedDict([('weight', 0.06045928834718992)]))]), 4: OrderedDict(), 'input': OrderedDict([('y1', OrderedDict([('weight', 0.0)]))]), 'y4': OrderedDict([(3, OrderedDict([('weight', 0.12254141747735424)])), (5, OrderedDict([('weight', 0.12254141747735425)]))]), 3: OrderedDict(), 5: OrderedDict(), 'y5': OrderedDict([(6, OrderedDict([('weight', 0.11700701511079069)])), (2, OrderedDict([('weight', 0.11700701511079069)]))]), 6: OrderedDict(), 1: OrderedDict(), 2: OrderedDict()}
G_sem = nx.from_dict_of_dicts(G_sem)

# Edge info
edge_input = ('input', 'y1')
weights_sem = np.array([G_sem[u][v]['weight']for u,v in G_sem.edges()]) * 256

# Layout
pos = nx.nx_agraph.graphviz_layout(G_scaffold, prog="dot", root="input")

# Plotting graph
pad = 10
with plt.style.context("ggplot"):
    fig, ax = plt.subplots(figsize=(8,8))
    linecollection = nx.draw_networkx_edges(G_sem, pos, alpha=0.5, edges=G_sem.edges(), arrowstyle="-", edge_color="#000000", width=weights_sem)
    x = np.stack(pos.values())[:,0]
    y =  np.stack(pos.values())[:,1]
    ax.set(xlim=(x.min()-pad,x.max()+pad), ylim=(y.min()-pad, y.max()+pad))

    for path, lw in zip(linecollection.get_paths(), linecollection.get_linewidths()):
        x = path.vertices[:,0]
        y = path.vertices[:,1]
        w = lw/4
        theta = np.arctan2(y[-1] - y[0], x[-1] - x[0])
    #     ax.plot(x, y, color="blue", linestyle=":")
        ax.plot((x-np.sin(theta)*w), y+np.cos(theta)*w, color="blue", linestyle=":")
        ax.plot((x+np.sin(theta)*w), y-np.cos(theta)*w, color="blue", linestyle=":")

After a couple of thought experiments, I realized I need to calculate the angle and then adjust the pads accordingly:

For example, if the line was completely vertical (at 90 or -90) then the y coords would not be shifted at all by the x coords would be shifted. The opposite would happen for a line with an angle 0 or 180.

However, it's still off a bit.

I suspect that this is relevant: matplotlib - Expand the line with specified width in data unit?

I don't think the linewidth directly translates to data space

Alternatively, if these line collections could be converted into rectangle objects then it would also be possible.

enter image description here

O.rka
  • 29,847
  • 68
  • 194
  • 309
  • Linewidth stays constant w.r.t pixel dimensions on your display. As soon as you resize the window, your solution that initially was just "a little bit off" will be very "off". Personally, I would not try to fix `networkx` but just draw objects with coordinates in data space. – Paul Brodersen May 02 '19 at 11:29

2 Answers2

6

The problem of surrounding a line with a certain width by another line is that the line is defined in data coordinates, while the linewidth is in a physical unit, namely points. This is in general desireable, because it allows to have the linewidth to be independent of the data range, zooming level etc. It also ensures that the end of the line is always perpendicular to the line, independent of the axes aspect.

So the outline of the line is always in a mixed coordinate system and the final appearance is not determined before drawing the actual line with the renderer. So for a solution that takes the (possibly changing) coordinates into account, one would need to determine the outline for the current state of the figure.

One option is to use a new artist, which takes the existing LineCollection as input and creates new transforms depending on the current position of the lines in pixel space.

In the following I chose a PatchCollection. Starting off with a rectangle, we can scale and rotate it and then translate it to the position of the original line.

import numpy as np
import matplotlib.pyplot as plt
from matplotlib.collections import LineCollection, PatchCollection
import matplotlib.transforms as mtrans


class OutlineCollection(PatchCollection):
    def __init__(self, linecollection, ax=None, **kwargs):
        self.ax = ax or plt.gca()
        self.lc = linecollection
        assert np.all(np.array(self.lc.get_segments()).shape[1:] == np.array((2,2)))
        rect = plt.Rectangle((-.5, -.5), width=1, height=1)
        super().__init__((rect,), **kwargs)
        self.set_transform(mtrans.IdentityTransform())
        self.set_offsets(np.zeros((len(self.lc.get_segments()),2)))
        self.ax.add_collection(self)

    def draw(self, renderer):
        segs = self.lc.get_segments()
        n = len(segs)
        factor = 72/self.ax.figure.dpi
        lws = self.lc.get_linewidth()
        if len(lws) <= 1:
            lws = lws*np.ones(n)
        transforms = []
        for i, (lw, seg) in enumerate(zip(lws, segs)):
            X = self.lc.get_transform().transform(seg)
            mean = X.mean(axis=0)
            angle = np.arctan2(*np.squeeze(np.diff(X, axis=0))[::-1])
            length = np.sqrt(np.sum(np.diff(X, axis=0)**2))
            trans = mtrans.Affine2D().scale(length,lw/factor).rotate(angle).translate(*mean)
            transforms.append(trans.get_matrix())
        self._transforms = transforms
        super().draw(renderer)

Note how the actual transforms are only calculated at draw time. This ensures that they take the actual positions in pixel space into account.

Usage could look like

verts = np.array([[[5,10],[5,5]], [[5,5],[8,2]], [[5,5],[1,4]], [[1,4],[2,0]]])

plt.rcParams["axes.xmargin"] = 0.1
fig, (ax1, ax2) = plt.subplots(ncols=2, sharex=True, sharey=True)

lc1 = LineCollection(verts, color="k", alpha=0.5, linewidth=20)
ax1.add_collection(lc1)

olc1 = OutlineCollection(lc1, ax=ax1, linewidth=2, 
                         linestyle=":", edgecolor="black", facecolor="none")


lc2 = LineCollection(verts, color="k", alpha=0.3, linewidth=(10,20,40,15))
ax2.add_collection(lc2)

olc2 = OutlineCollection(lc2, ax=ax2, linewidth=3, 
                         linestyle="--", edgecolors=["r", "b", "gold", "indigo"], 
                        facecolor="none")

for ax in (ax1,ax2):
    ax.autoscale()
plt.show()

enter image description here

Now of course the idea is to use the linecollection object from the question instead of the lc1 object from the above. This should be easy enough to replace in the code.

ImportanceOfBeingErnest
  • 321,279
  • 53
  • 665
  • 712
  • I finally figured out how to adapt my code for this! Thank you. This was a huge answer. I know it must have taken some time. I had no idea it would be this complicated but what you're saying makes a lot of sense. – O.rka May 09 '19 at 02:18
  • Do you have any suggestions on how to adapt this to `nx.DiGraph` objects that output `FancyArrowPatch` objects instead? I've tried using `PatchCollection([FancyArrowPatches from nx.draw_networkx_edges])` but I got `AttributeError: 'PatchCollection' object has no attribute 'get_segments'` – O.rka May 09 '19 at 19:15
  • Are you saying you don't have a `LineCollection` at all? Or is this a new problem? FancyArrowPatches can be arcs or othwise bent, so a totally different strategy would need to be used. – ImportanceOfBeingErnest May 09 '19 at 20:19
  • When I replicated my real data into a simplified form for this post, I used `nx.Graph` instead of my original `nx.OrderedDiGraph`. I've gotten your method to work perfectly for `nx.Graph` (thanks again) but did not realize that `nx.OrderedDiGraph` returns a list of `FancyArrowPatches`. I almost have the script adapted to incorporate it https://pastebin.com/raw/jzL92vdW but I'm getting a strange offset https://i.imgur.com/sQys7Jz.png in the final plot. – O.rka May 09 '19 at 21:13
  • I do not have a runnable networkx available at the moment and will probably not be able to look further into this for the next week or so. – ImportanceOfBeingErnest May 09 '19 at 21:46
  • I ended up using the `arrows=False` option on `nx.draw_networkx_edges` so it works now! It's not with the FancyArrowPatch but oh well...it's not necessary for what I was trying to do. Cheers – O.rka May 10 '19 at 00:43
1

The objects in LineCollection do not have distinct edgecolor and facecolor. By trying to set the linestyle, you are affecting the style of the entire line segment. I found it easier to create the desired effect by using a series of patches. Each patch represents an edge of the graph. The edgecolor, linestyle, linewidth, and facecolor of the patches can be manipulated individually. The trick is building a function to convert an edge into a rotated Rectangle patch.

import matplotlib.path as mpath
import matplotlib.patches as mpatches
import numpy as np
from matplotlib import pyplot as plt
import networkx as nx

G = nx.Graph()
for i in range(10):
    G.add_node(i)
for i in range(9):
    G.add_edge(9, i)

# make a square figure so the rectangles look nice
plt.figure(figsize=(10,10))
plt.xlim(-1.1, 1.1)
plt.ylim(-1.1, 1.1)

def create_patch(startx, starty, stopx, stopy, width, w=.1):
    # Check if lower right corner is specified.
    direction = 1
    if startx > stopx:
        direction = -1

    length = np.sqrt((stopy-starty)**2 + (stopx-startx)**2)
    theta = np.arctan((stopy-starty)/(stopx-startx))
    complement = np.pi/2 - theta

    patch = mpatches.Rectangle(
        (startx+np.cos(complement)*width/2, starty-np.sin(complement)*width/2), 
        direction * length,
        width,
        angle=180/np.pi*theta, 
        facecolor='#000000', 
        linestyle=':', 
        linewidth=width*10,
        edgecolor='k',
        alpha=.3
    )
    return patch

# Create layout before building edge patches
pos = nx.circular_layout(G)

for i, edge in enumerate(G.edges()):
    startx, starty = pos[edge[0]]
    stopx, stopy = pos[edge[1]]
    plt.gca().add_patch(create_patch(startx, starty, stopx, stopy, (i+1)/10))

plt.show()

Image of width and linestyle changes.

In your example, you noticed that we can use the X and Y positions of the edges to find the angle of rotation. We use the same trick here. Notice also that sometimes the magnitude of the rectangle length is negative. The Rectangle Patch assumes that the x and y inputs refer to the lower left corner of the rectangle. We run a quick check to make sure that's true. If false, we've specified the top first. In that case, we draw the rectangle backwards along the same angle.

Another gotcha: it's important to run your layout algorithm before creating the patches. Once the pos is specified, we can use the edges to look up the start and stop locations.

Opportunity for Improvement: Rather than plotting each patch as you generate it, you can use a PatchCollection and manipulate the patches in bulk. The docs claim that PatchCollection is faster, but it may not fit all use cases. Since you expressed a desire to set properties on each patch independently, the collection might not offer the flexibility you need.

SNygard
  • 916
  • 1
  • 9
  • 21
  • The main assumption here is that the graph in shown on a scale with equal aspect (i.e. one unit in y direction has the same length as one unit in x direction). According to the image in the question, that is not necessarily the case. – ImportanceOfBeingErnest May 02 '19 at 20:07
  • That's a good point. I'll have to consider how to do this in other aspect ratios (ideally we won't have to know the aspect ratio in advance...) – SNygard May 03 '19 at 16:46
  • When I use on my example: ZeroDivisionError: theta = np.arctan((stopy-starty)/(stopx-startx)) ZeroDivisionError: float division by zero – O.rka May 07 '19 at 19:11