1

I'm currently working on data which contains 4 variables. I'm using only one at the moment. This variable contains low and high values.

I would like to extract all the values which represent a peak. Then I could examine the variability of these (cloud of dots).

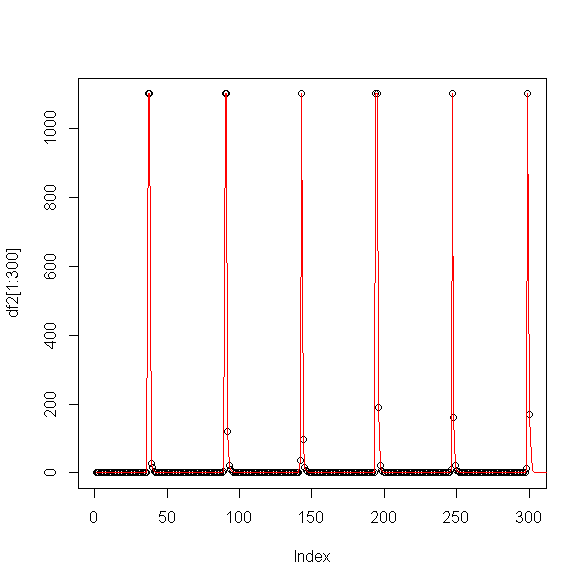
Here is a graphic of my initial data (it represents the 300 first values) :

from https://nsa40.casimages.com/img/2019/04/17/190417051436974902.png

Here is an other grahic which overlay cycle: from https://nsa40.casimages.com/img/2019/04/18/190418060806126859.png

Here are the values I would like to extract (I didn't surround all the values) : from https://nsa40.casimages.com/img/2019/04/30/190430124733801147.png

The first 300 values :

c(0.096, 0.088, 0.082, 0.078, 0.06, 0.057, 0.048, 0.047, 0.044,
0.044, 0.039, 0.038, 0.037, 0.037, 0.035, 0.035, 0.034, 0.034,
0.033, 0.033, 0.032, 0.032, 0.031, 0.031, 0.031, 0.031, 0.03,
0.03, 0.03, 0.03, 0.03, 0.029, 0.029, 0.029, 0.029, 0.2, 1100,
1100, 27, 15, 3.2, 2.2, 1, 0.65, 0.37, 0.3, 0.19, 0.16, 0.12,
0.12, 0.099, 0.096, 0.085, 0.082, 0.064, 0.06, 0.051, 0.05, 0.046,
0.045, 0.041, 0.041, 0.039, 0.038, 0.037, 0.036, 0.035, 0.035,
0.034, 0.033, 0.032, 0.032, 0.032, 0.031, 0.031, 0.031, 0.03,
0.03, 0.03, 0.03, 0.029, 0.029, 0.029, 0.029, 0.029, 0.028, 0.028,
0.028, 4.4, 1100, 1100, 120, 21, 9.4, 3.1, 1.6, 0.85, 0.51, 0.33,
0.23, 0.18, 0.18, 0.13, 0.11, 0.1, 0.092, 0.085, 0.077, 0.065,
0.058, 0.053, 0.05, 0.047, 0.045, 0.043, 0.042, 0.039, 0.038,
0.037, 0.036, 0.035, 0.035, 0.034, 0.033, 0.033, 0.032, 0.031,
0.031, 0.031, 0.03, 0.03, 0.03, 0.029, 0.029, 0.029, 0.029, 0.028,
0.028, 0.028, 0.028, 0.028, 37, 1100, 98, 17, 6.2, 2.7, 1.3,
1, 0.47, 0.31, 0.23, 0.16, 0.14, 0.11, 0.1, 0.093, 0.087, 0.079,
0.066, 0.057, 0.053, 0.049, 0.046, 0.044, 0.041, 0.04, 0.037,
0.036, 0.035, 0.035, 0.033, 0.033, 0.032, 0.032, 0.031, 0.031,
0.03, 0.03, 0.029, 0.029, 0.029, 0.029, 0.028, 0.028, 0.028,
0.027, 0.027, 0.027, 0.026, 0.026, 0.026, 2.6, 1100, 1100, 190,
22, 7.8, 3.2, 2.2, 0.91, 0.51, 0.37, 0.23, 0.18, 0.14, 0.12,
0.11, 0.098, 0.09, 0.085, 0.071, 0.061, 0.055, 0.051, 0.049,
0.045, 0.043, 0.04, 0.039, 0.037, 0.036, 0.035, 0.034, 0.033,
0.032, 0.032, 0.031, 0.031, 0.03, 0.03, 0.03, 0.029, 0.029, 0.028,
0.028, 0.028, 0.027, 0.027, 0.027, 0.026, 0.026, 0.026, 0.026,
0.026, 8.8, 1100, 160, 21, 7.5, 3.4, 1.6, 0.89, 0.52, 0.33, 0.23,
0.17, 0.14, 0.13, 0.1, 0.094, 0.087, 0.078, 0.065, 0.056, 0.051,
0.049, 0.045, 0.043, 0.039, 0.039, 0.036, 0.035, 0.034, 0.033,
0.032, 0.032, 0.031, 0.03, 0.03, 0.03, 0.029, 0.029, 0.028, 0.028,
0.027, 0.027, 0.026, 0.026, 0.026, 0.026, 0.025, 0.025, 0.025,
0.025, 0.025, 0.025, 13, 1100, 170)

I apologize for not being word-perfect in English.

Thank you.

Miles
  • 69
  • 8
  • 2
    Please share sample data with `dput` – Sonny Apr 30 '19 at 09:54
  • 2
    min, max, which.min, which.max? – Dmitriy Apr 30 '19 at 09:55
  • 1
    Hi @Miles. Welcome to SO. Please take a look at [How to make a great R reproducible example](https://stackoverflow.com/questions/5963269/how-to-make-a-great-r-reproducible-example). If you provide some sample of your data it'd be easier to help you! – patL Apr 30 '19 at 09:55
  • Please explain why min/max, which.min/which.max aren't what you're looking for? What does *"all the values which represent a peak"* mean? Do you mean "> x larger (smaller) than their n neighbors?", if so what size is sliding window n?* Please show sample data and an example of what you mean. – smci Apr 30 '19 at 09:57
  • Try this link that has some code for local extrema : https://rtricks.wordpress.com/2009/05/03/an-algorithm-to-find-local-extrema-in-a-vector/ – Rohit Apr 30 '19 at 10:01
  • By saying "peak". I mean the maximum value of a cycle. – Miles Apr 30 '19 at 10:26
  • What is the result that you expect for the function, @Miles? What should it return? – Roman Apr 30 '19 at 10:35
  • Miles, do you mean "detect stable frequency components in my series"? – Dmitriy Apr 30 '19 at 10:40
  • @Rohit Do you know how to use this algorithm ? https://rtricks.wordpress.com/2009/05/03/an-algorithm-to-find-local-extrema-in-a-vector/ – Miles May 12 '19 at 15:45

2 Answers2

3

take a look at the ggpmiscpackage (https://github.com/cran/ggpmisc).

the function you are looking for is ggpmisc::stat_peaks

library(ggplot2)
library(ggpmisc)
#> For news about 'ggpmisc', please, see https://www.r4photobiology.info/

ggplot(lynx, as.numeric = FALSE) + geom_line() + 
  stat_peaks(colour = "red") +
  stat_peaks(geom = "text", colour = "red", angle = 66,
             hjust = -0.1, x.label.fmt = "%Y") +
  expand_limits(y = 8000)

Created on 2019-04-30 by the reprex package (v0.2.1)

FMM
  • 1,857
  • 1
  • 15
  • 38
  • It works well but I still have an issue. It gives me highest but also lowest values. How can I fix it ? I would like to have only highest values. link : https://nsa40.casimages.com/img/2019/04/30/190430025549392220.png – Miles Apr 30 '19 at 12:56
  • 1
    I guess it is also getting peaks over there... try playing around with the `span` argument... the default is 5.. judging by your graph, try to add `span = 50`, or even `span = 25` to see if it changes anything – FMM Apr 30 '19 at 14:25
0

My answer based on https://rtricks.wordpress.com/2009/05/03/an-algorithm-to-find-local-extrema-in-a-vector/ You can use the function there as shown below. Vary the bw parameter as required. If you have corresponding x coordinates, then use the x.coo arguement.

y <- c(0.096, 0.088, 0.082, 0.078, 0.06, 0.057, 0.048, 0.047, 0.044,
       0.044, 0.039, 0.038, 0.037, 0.037, 0.035, 0.035, 0.034, 0.034,
       0.033, 0.033, 0.032, 0.032, 0.031, 0.031, 0.031, 0.031, 0.03,
       0.03, 0.03, 0.03, 0.03, 0.029, 0.029, 0.029, 0.029, 0.2, 1100,
       1100, 27, 15, 3.2, 2.2, 1, 0.65, 0.37, 0.3, 0.19, 0.16, 0.12,
       0.12, 0.099, 0.096, 0.085, 0.082, 0.064, 0.06, 0.051, 0.05, 0.046,
       0.045, 0.041, 0.041, 0.039, 0.038, 0.037, 0.036, 0.035, 0.035,
       0.034, 0.033, 0.032, 0.032, 0.032, 0.031, 0.031, 0.031, 0.03,
       0.03, 0.03, 0.03, 0.029, 0.029, 0.029, 0.029, 0.029, 0.028, 0.028,
       0.028, 4.4, 1100, 1100, 120, 21, 9.4, 3.1, 1.6, 0.85, 0.51, 0.33,
       0.23, 0.18, 0.18, 0.13, 0.11, 0.1, 0.092, 0.085, 0.077, 0.065,
       0.058, 0.053, 0.05, 0.047, 0.045, 0.043, 0.042, 0.039, 0.038,
       0.037, 0.036, 0.035, 0.035, 0.034, 0.033, 0.033, 0.032, 0.031,
       0.031, 0.031, 0.03, 0.03, 0.03, 0.029, 0.029, 0.029, 0.029, 0.028,
       0.028, 0.028, 0.028, 0.028, 37, 1100, 98, 17, 6.2, 2.7, 1.3,
       1, 0.47, 0.31, 0.23, 0.16, 0.14, 0.11, 0.1, 0.093, 0.087, 0.079,
       0.066, 0.057, 0.053, 0.049, 0.046, 0.044, 0.041, 0.04, 0.037,
       0.036, 0.035, 0.035, 0.033, 0.033, 0.032, 0.032, 0.031, 0.031,
       0.03, 0.03, 0.029, 0.029, 0.029, 0.029, 0.028, 0.028, 0.028,
       0.027, 0.027, 0.027, 0.026, 0.026, 0.026, 2.6, 1100, 1100, 190,
       22, 7.8, 3.2, 2.2, 0.91, 0.51, 0.37, 0.23, 0.18, 0.14, 0.12,
       0.11, 0.098, 0.09, 0.085, 0.071, 0.061, 0.055, 0.051, 0.049,
       0.045, 0.043, 0.04, 0.039, 0.037, 0.036, 0.035, 0.034, 0.033,
       0.032, 0.032, 0.031, 0.031, 0.03, 0.03, 0.03, 0.029, 0.029, 0.028,
       0.028, 0.028, 0.027, 0.027, 0.027, 0.026, 0.026, 0.026, 0.026,
       0.026, 8.8, 1100, 160, 21, 7.5, 3.4, 1.6, 0.89, 0.52, 0.33, 0.23,
       0.17, 0.14, 0.13, 0.1, 0.094, 0.087, 0.078, 0.065, 0.056, 0.051,
       0.049, 0.045, 0.043, 0.039, 0.039, 0.036, 0.035, 0.034, 0.033,
       0.032, 0.032, 0.031, 0.03, 0.03, 0.03, 0.029, 0.029, 0.028, 0.028,
       0.027, 0.027, 0.026, 0.026, 0.026, 0.026, 0.025, 0.025, 0.025,
       0.025, 0.025, 0.025, 13, 1100, 170)


findpeaks <- function(vec,bw=1,x.coo=c(1:length(vec))){
  pos.x.max <- NULL
  pos.y.max <- NULL
  pos.x.min <- NULL
  pos.y.min <- NULL     
  for(i in 1:(length(vec)-1))   {       
    if((i+1+bw)>length(vec)){
    sup.stop <- length(vec)}else{sup.stop <- i+1+bw
    }
    if((i-bw)<1){
      inf.stop <- 1
    }else{
        inf.stop <- i-bw
        }
    subset.sup <- vec[(i+1):sup.stop]
    subset.inf <- vec[inf.stop:(i-1)]

    is.max   <- sum(subset.inf > vec[i]) == 0
    is.nomin <- sum(subset.sup > vec[i]) == 0

    no.max   <- sum(subset.inf > vec[i]) == length(subset.inf)
    no.nomin <- sum(subset.sup > vec[i]) == length(subset.sup)

    if(is.max & is.nomin){
      pos.x.max <- c(pos.x.max,x.coo[i])
      pos.y.max <- c(pos.y.max,vec[i])
    }
    if(no.max & no.nomin){
      pos.x.min <- c(pos.x.min,x.coo[i])
      pos.y.min <- c(pos.y.min,vec[i])
    }
  }
  return(list(pos.x.max,pos.y.max,pos.x.min,pos.y.min))
}

ex <- findpeaks(y,bw=10) # Vary bw till you get the results you expect
plot(y,type = 'l')
lines(ex[[1]],ex[[2]])

Created on 2019-05-13 by the reprex package (v0.2.1)

Rohit
  • 1,967
  • 1
  • 12
  • 15