0

I have a set of 100 random 2D points (between 0 and 20) in a scatter plot with 2 sub plots surrounding the main. When I zoom in the main scatter plot, the range on the subplots gets shrunk, however I can see points from outside the zoom window region.

import numpy as np
import matplotlib
import matplotlib.pyplot as plt

import random

numPoints = 100
x = [random.uniform(0, 20) for i in range(numPoints)]
y = [random.uniform(0, 20) for i in range(numPoints)]

# Set up the axes with gridspec
fig = plt.figure(figsize=(6, 6), constrained_layout=True)

grid = fig.add_gridspec(ncols=2, nrows=2, width_ratios=[0.3, 5], height_ratios=[5, 0.3])

main_ax = fig.add_subplot(grid[:-1, 1:])
main_ax.plot(x, y, 'ok', markersize=3, alpha=0.2)

y_hist = fig.add_subplot(grid[:-1, 0], xticklabels=[], sharey=main_ax)
x_hist = fig.add_subplot(grid[-1, 1:], yticklabels=[], sharex=main_ax)

x_hist.plot(
    x, [0 for i in x], 
    'ok',
    color='gray'
)
x_hist.invert_yaxis()

y_hist.plot(
    [0 for i in y], y,
    'ok',
    color='gray'
)
y_hist.invert_xaxis()

main_ax.grid(True, lw = 1, ls = '--', c = '.75')
x_hist.grid(True, axis="x", lw = 1, ls = '--', c = '.75')
y_hist.grid(True, axis="y", lw = 1, ls = '--', c = '.75')

plt.show()

image

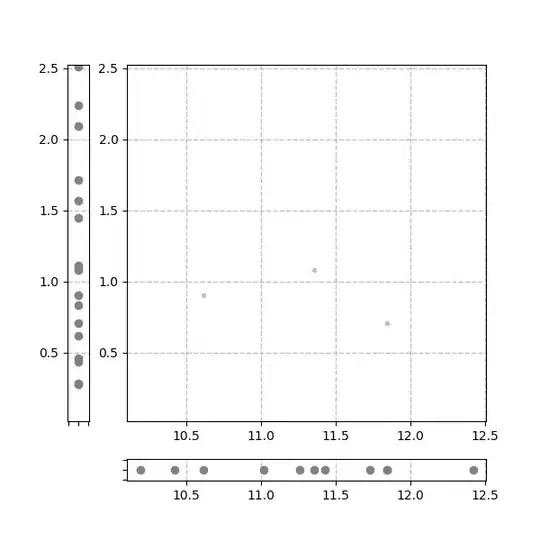
I am trying to get the dots in the left and bottom sub plots of the above image to match just what you see in the main plot (3 points).

Instead they show everything in that direction. The Left subplot shows every point on the x axis between 0 and 2.5. The bottom subplot shows every point on the y axis between 10 and 12.5.

miselking
  • 3,043
  • 4
  • 28
  • 39

1 Answers1

0

You would need to filter the data, depending on the limits of the main axes. One can connect callbacks on zoom events, see Matplotlib: Finding out xlim and ylim after zoom and connect them to a function that performs the filtering on the data.

import numpy as np
import matplotlib.pyplot as plt


numPoints = 100
x = np.random.rand(numPoints)*20
y = np.random.rand(numPoints)*20

zeros = np.zeros_like(x)

# Set up the axes with gridspec
fig = plt.figure(figsize=(6, 6), constrained_layout=True)
grid = fig.add_gridspec(ncols=2, nrows=2, width_ratios=[0.3, 5], height_ratios=[5, 0.3])

ax_main = fig.add_subplot(grid[:-1, 1:])
ax_y = fig.add_subplot(grid[:-1, 0], xticklabels=[], sharey=ax_main)
ax_x = fig.add_subplot(grid[-1, 1:], yticklabels=[], sharex=ax_main)

ax_main.plot(x, y, 'ok', markersize=3, alpha=0.2)
xline, = ax_x.plot(x, zeros, marker='o', ls="none", color='gray')
yline, = ax_y.plot(zeros, y, marker='o', ls="none", color='gray')

ax_main.grid(True, lw = 1, ls = '--', c = '.75')
ax_y.grid(True, axis="x", lw = 1, ls = '--', c = '.75')
ax_x.grid(True, axis="y", lw = 1, ls = '--', c = '.75')


def xchange(evt):
    ymin, ymax = ax_main.get_ylim()
    filt = (y <= ymax) & (y >= ymin)
    xline.set_data(x[filt], zeros[filt])

def ychange(evt):
    xmin, xmax = ax_main.get_xlim()
    filt = (x <= xmax) & (x >= xmin)
    yline.set_data(zeros[filt], y[filt])

ax_main.callbacks.connect('xlim_changed', ychange)
ax_main.callbacks.connect('ylim_changed', xchange)

plt.show()

enter image description here

ImportanceOfBeingErnest
  • 321,279
  • 53
  • 665
  • 712
  • wonderful, my first impression was to use the callback, but I wanted to double check to make sure I wasnt missing anything obvious. thanks! :) – jaegerbomb May 01 '19 at 23:02
  • You mean I could have saved the time writing all of this down because you knew the solution already???? – ImportanceOfBeingErnest May 01 '19 at 23:17
  • No just intuition (i havent used events in matplotlib before), but this library is quite complete and complicated, i figured there was another way. – jaegerbomb May 02 '19 at 01:12