1

I am trying to add a custom colorbar to my matplotlib figure, that runs from full transparent (white) to full color (mediumpurple).

I have come far, but still a few issues. The way I make this, creates lines between each patch, which are visible. This creates artifacts when I try to make the colorbar look fluent.

fig, ax = plt.subplots(figsize=(10, 10))
max_val = 4
transparency_ticks = 500
color = mpl.colors.to_rgba(color)
cmap = mpl.colors.ListedColormap([(*color[:3], (1+a)/transparency_ticks) for a in range(transparency_ticks)])
norm = mpl.colors.Normalize(vmin=0, vmax=max_val)
cax = fig.add_axes([0.8, 0.17, 0.05, 0.5])
mpl.colorbar.ColorbarBase(cax, cmap=cmap, norm=norm, orientation='vertical')

This is the image for transparency_ticks = 500. So you can see the lines between each patch.

Lines visible

This is the image for transparency_ticks = 5000. You don't see the lines anymore since they have blended with the rest, but these lines make the colorbar look a lot darker.
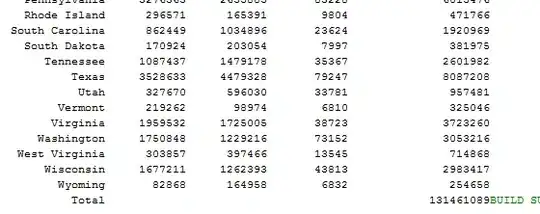
Lines make colorbar darker than it should be

Hielke Walinga
  • 2,677
  • 1
  • 17
  • 30
  • I think you can try `cbar.solids.set_rasterized(True)`... – Jody Klymak May 08 '19 at 17:40
  • @JodyKlymak I looked further and apparently this would be the correct answer. However, this is bugged. This hack that suggested a manual alpha blending solved it: https://stackoverflow.com/a/35672224/8477066 – Hielke Walinga May 08 '19 at 18:31
  • Umm ok didn’t realize you were using alpha for your colours. Why don’t you just make the colormap go from white to purple? Do you need it to be transparent because you want to see something under the transparent part? – Jody Klymak May 08 '19 at 18:39
  • @JodyKlymak I am not so experienced with this. How do I make a colormap go from white to purple? – Hielke Walinga May 08 '19 at 19:25
  • There is an example here that goes from brown to white, you can probably figure out how to go from purple to white... https://matplotlib.org/tutorials/colors/colormap-manipulation.html#sphx-glr-tutorials-colors-colormap-manipulation-py – Jody Klymak May 08 '19 at 20:57
  • Here is a proposed workaround with calculated mimicked alpha values: https://stackoverflow.com/a/64201085/2084944 – Tik0 Oct 05 '20 at 00:21

1 Answers1

2

Instead of levels onRGBA, use HSV with various saturation:

fig, ax = plt.subplots(figsize=(10, 10))
max_val = 4
transparency_ticks = 50
colors = [mpl.colors.hsv_to_rgb((0.83, a/transparency_ticks, 1)) 
          for a in range(transparency_ticks)]
cmap = mpl.colors.ListedColormap(colors)
norm = mpl.colors.Normalize(vmin=0, vmax=max_val)
cax = fig.add_axes([0.8, 0.17, 0.05, 0.5])
mpl.colorbar.ColorbarBase(cax, cmap=cmap, norm=norm, orientation='vertical')

enter image description here

Quang Hoang
  • 146,074
  • 10
  • 56
  • 74