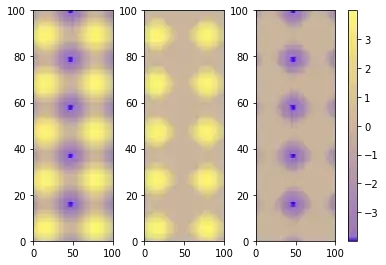
What I want is the Y axis of the subplot to have standard values for the tick points e.g 21.99, 22, 20.01. I'd like for them to be dynamic enough so that can adapt to the new data being used in the chart when it's refreshed.
Using the subplots default auto-scaling the dynamic aspect is achieved however an offset is shown which refer to the y axis tick points.
When I change the layout to tight using:
ax.autoscale(axis='y', tight=True)
It removes the first issue but means the spacing between the UCL and the border is too tight.
I need code to produce a scale much like the one seen on the bottom image yet chart positioning to remain the same much like the first image.

