Thanks to this answer for a related question in Python, I've written some Julia code to display histograms in a for loop.
using PyPlot

γvec = 0.1:0.1:0.9   # γ : fixed paramter
N = 1000     # N : number of samples for each γ

fig, axs = subplots(length(γvec), 1, figsize=(10, 6.18*length(γvec)), constrained_layout=true)
fig.suptitle("Distribution of eigenvalues of ρ at final time", fontsize=20, y=1)

# TL;DR
λ₁vec, λ₂vec = zeros(Complex{Float64}, N), zeros(Complex{Float64}, N);

for (iᵧ, γ) in enumerate(γvec)
  # println(γ)
  samples = [ myfunction(...) for _ in 1:N ];  # draw samples
  for i in 1:N
    λ₁₂ = eigvals(samples[i][1])  # calculate (real-valued) eigenvalues of ρ
    λ₁vec[i], λ₂vec[i] = maximum(real(λ₁₂)), minimum(real(λ₁₂))
  end
  axs[iᵧ].hist(λ₁vec)  # plot histogram of eigenvalues of ρ
  axs[iᵧ].hist(λ₂vec)
  axs[iᵧ].set_title("γ = $γ")
  axs[iᵧ].set_xlabel("eigenvalues of ρ")
end
gcf() # get current figure
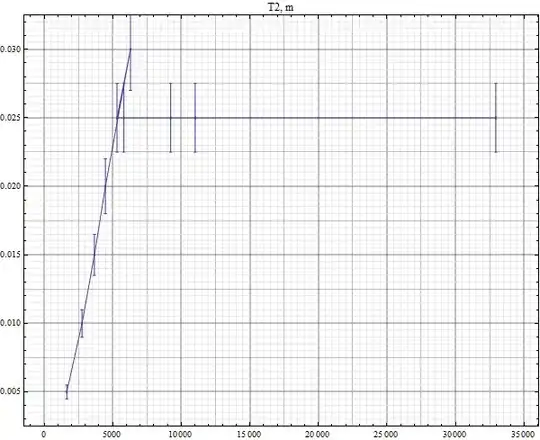
To create the figure, I've adpated the syntax from another answer and read an e-book's sample code on GitHub. Here's the figure that I've made.
Overlapping title and subtitle produced by Julia's PyPlot. What can be done to properly display the title and subtitles?
Edited in reponse to comments.
I'm using the lastest version of Juno and Julia.

