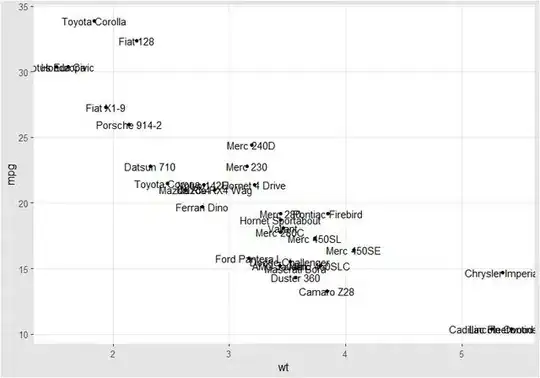
I got the following graphs using the code given below:
library(ggplot2)
library(ggthemes)

p <- ggplot(data = mtcars, mapping = aes(x = wt, y = mpg)) +
     geom_point() +
     theme_igray()
p
p + geom_text(mapping = aes(label = rownames(mtcars)))

p + geom_text(mapping = aes(label = rownames(mtcars)), family = "Times New Roman")
The font for the geom_text is different from the font of rest of graph. I wonder how can I get same font for geom_text as the font of rest of graph.
Edited
sessionInfo()
R version 3.6.0 (2019-04-26)
Platform: x86_64-pc-linux-gnu (64-bit)
Running under: Ubuntu 18.04.2 LTS

Matrix products: default
BLAS:   /usr/lib/x86_64-linux-gnu/atlas/libblas.so.3.10.3
LAPACK: /usr/lib/x86_64-linux-gnu/atlas/liblapack.so.3.10.3

locale:
 [1] LC_CTYPE=en_US.UTF-8       LC_NUMERIC=C
 [3] LC_TIME=en_US.UTF-8        LC_COLLATE=en_US.UTF-8
 [5] LC_MONETARY=en_US.UTF-8    LC_MESSAGES=en_US.UTF-8
 [7] LC_PAPER=en_US.UTF-8       LC_NAME=C
 [9] LC_ADDRESS=C               LC_TELEPHONE=C
[11] LC_MEASUREMENT=en_US.UTF-8 LC_IDENTIFICATION=C

attached base packages:
[1] stats     graphics  grDevices utils     datasets  methods   base

other attached packages:
[1] ggthemes_4.2.0 ggplot2_3.1.1

loaded via a namespace (and not attached):
 [1] Rcpp_1.0.1       rstudioapi_0.10  magrittr_1.5     tidyselect_0.2.5
 [5] munsell_0.5.0    colorspace_1.4-1 R6_2.4.0         rlang_0.3.4.9003
 [9] stringr_1.4.0    plyr_1.8.4       dplyr_0.8.1      tools_3.6.0
[13] grid_3.6.0       gtable_0.3.0     withr_2.1.2      lazyeval_0.2.2
[17] assertthat_0.2.1 tibble_2.1.1     crayon_1.3.4     purrr_0.3.2
[21] vctrs_0.1.0.9003 zeallot_0.1.0    glue_1.3.1       labeling_0.3
[25] stringi_1.4.3    compiler_3.6.0   pillar_1.4.0     scales_1.0.0
[29] backports_1.1.4  pkgconfig_2.0.2
