0

I used the ggplot2 to make a histogram. But the height of columns didn't follow the proportion of values on y-axis. Also the order of the value on y-axis isn't correct.

#This is the code I used.
data1 <- matrix(c("1", "2", "3", "4304", "456", "30"), nrow = 3, ncol = 2, dimnames = list(1:3, c("number_gRNA", "ncell")))

ggplot(data1, aes(number_gRNA, ncell)) + geom_col(width = 0.4, fill="#56B4E9", colour="black") + ggtitle("sgRNA distribution")

enter image description here

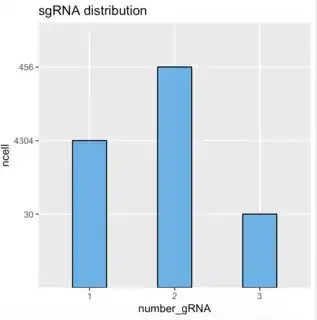
I hope the height of columns can follow the proportion with their values. Meanwhile, the values on the y-axis follow increasing order.

divibisan
  • 11,659
  • 11
  • 40
  • 58
Lin Yang
  • 45
  • 2
  • Possible duplicate of [Reorder bars in geom\_bar ggplot2](https://stackoverflow.com/questions/25664007/reorder-bars-in-geom-bar-ggplot2) – divibisan May 20 '19 at 19:09
  • You're using characters, i.e. `"456"` instead of `456`. There's nothing telling `ggplot` to convert those to numbers, so it doesn't – camille May 20 '19 at 20:22
  • Possible duplicate of [Wrong order of y axis in ggplot barplot](https://stackoverflow.com/questions/25081052/wrong-order-of-y-axis-in-ggplot-barplot) – camille May 20 '19 at 21:11

1 Answers1

3

OK I made 2 simple changes to make it work.

First of all, ggplot() wouldn't take a matrix, so I used as_tibble() to make it work.

But to your question, it's taking number_gRNA as a character, and just assuming it's categorical. So you need as.numeric() to make that happen.

library(tidyverse)

data1 <- matrix(
  c("1", "2", "3", "4304", "456", "30"),
  nrow = 3,
  ncol = 2,
  dimnames = list(1:3, c("number_gRNA", "ncell"))
)
data1 %>% 
  as_tibble() %>% 
  mutate(ncell = as.numeric(ncell)) %>% 
  ggplot(aes(number_gRNA, ncell)) +
  geom_col(width = 0.4, fill = "#56B4E9", colour = "black") +
  ggtitle("sgRNA distribution")
Benjamin
  • 876
  • 4
  • 8