-4

I want to apply a hierarchical cluster analysis with R. I am aware of the hclust() function but not how to use this in practice; I'm stuck with supplying the data to the function and processing the output.

I would also like to compare the hierarchical clustering with that produced by kmeans(). Again I am not sure how to call this function or use/manipulate the output from it.

My data are similar to:

## dummy data
require(MASS)
set.seed(1)
dat <- data.frame(mvrnorm(100, mu = c(2,6,3), 
                          Sigma = matrix(c(10,   2,   4,
                                            2,   3, 0.5,
                                            4, 0.5,   2), ncol = 3)))
Gavin Simpson
  • 170,508
  • 25
  • 396
  • 453
sridher
  • 151
  • 1
  • 2
  • 7
    I have attempted to improve the original question because (and I am not an independent observer but...) I think the Answers here are at least useful and deserves to remain here. Please help by editing it if you can improve further. – Gavin Simpson Oct 16 '12 at 15:00
  • 5
    @Gavin Simpson: You are a saint, and I have reopened the question. I have also deleted all comments previously posted as they're no longer relevant (not to mention a real eyesore), and will clean these up once you see them. – BoltClock Oct 16 '12 at 19:00
  • Does it really make sense to largely replace a busted question that is over a year old and should be answered with the famous "read the manual" or "google for 'hclust R tutorial'"? Plus, I wouldn't be surprised if there are already 10 duplicates here. – Has QUIT--Anony-Mousse Oct 16 '12 at 22:09
  • 2
    Then close the question as a duplicate. Then the answer can be merged or preserved. If there were no good answers then I would agree, but there is & people were trying to delete this on quality of question alone. At least the question doesn't stink now. Advice on Meta is to do what I have done. – Gavin Simpson Oct 17 '12 at 07:41
  • @BoltClock Thanks for this. I have also edited the Answer so it meshes more with the edited question. The comment trail on the Answer could now do with a clear up if you get a chance. I can delete some of mine but those of the OP will need some mod attention. Will flag later. – Gavin Simpson Oct 17 '12 at 08:57

1 Answers1

63

For hierarchical cluster analysis take a good look at ?hclust and run its examples. Alternative functions are in the cluster package that comes with R. k-means clustering is available in function kmeans() and also in the cluster package.

A simple hierarchical cluster analysis of the dummy data you show would be done as follows:

## dummy data first
require(MASS)
set.seed(1)
dat <- data.frame(mvrnorm(100, mu = c(2,6,3), 
                          Sigma = matrix(c(10,   2,   4,
                                            2,   3, 0.5,
                                            4, 0.5,   2), ncol = 3)))

Compute the dissimilarity matrix using Euclidean distances (you can use whatever distance you want)

dij <- dist(scale(dat, center = TRUE, scale = TRUE))

Then cluster them, say using the group average hierarchical method

clust <- hclust(dij, method = "average")

Printing the result gives us:

R> clust

Call:
hclust(d = dij, method = "average")

Cluster method   : average 
Distance         : euclidean 
Number of objects: 100
Plot the dendrogram

but that simple output belies a complex object that needs further functions to extract or use the information contained therein:

R> str(clust)
List of 7
 $ merge      : int [1:99, 1:2] -12 -17 -40 -30 -73 -23 1 -52 -91 -45 ...
 $ height     : num [1:99] 0.0451 0.0807 0.12 0.1233 0.1445 ...
 $ order      : int [1:100] 84 14 24 67 46 34 49 36 41 52 ...
 $ labels     : NULL
 $ method     : chr "average"
 $ call       : language hclust(d = dij, method = "average")
 $ dist.method: chr "euclidean"
 - attr(*, "class")= chr "hclust"

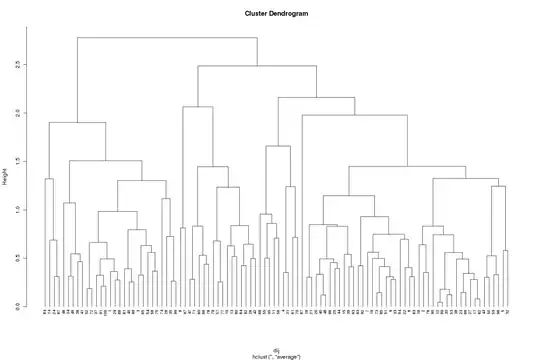
The dendrogram can be generated using the plot() method (hang gets the labels at the bottom of the dendrogram, along the x-axis, and cex just shrinks all the labels to 70% or normal)

plot(clust, hang = -0.01, cex = 0.7)

dendrogram

Say we want a 3-cluster solution, cut the dendrogram to produce 3 groups and return the cluster memberships

R> cutree(clust, k = 3)
  [1] 1 2 1 2 2 3 2 2 2 3 2 2 3 1 2 2 2 2 2 2 2 2 2 1 2 3 2 1 1 2 2 2 2 1 1 1 1
 [38] 2 2 2 1 3 2 2 1 1 3 2 1 2 2 1 2 1 2 2 3 1 2 3 2 2 2 3 1 3 1 2 2 2 3 1 2 1
 [75] 1 2 3 3 3 3 1 3 2 1 2 2 2 1 2 2 1 2 2 2 2 2 3 1 1 1

That is, cutree() returns a vector the same length as the number of observations clustered, the elements of which contain the group ID that each observation belongs. The membership is the ID of the leaf into which each observation falls when the dendrogram is cut at a stated height or, as done here, at the appropriate height to provide the stated number of groups.

Perhaps that gives you enough to be going on with?

For k-means, we would do this

set.seed(2) ## *k*-means uses a random start
klust <- kmeans(scale(dat, center = TRUE, scale = TRUE), centers = 3)
klust

which gives

> klust
K-means clustering with 3 clusters of sizes 41, 27, 32

Cluster means:
           X1          X2          X3
1  0.04467551  0.69925741 -0.02678733
2  1.11018549 -0.01169576  1.16870206
3 -0.99395950 -0.88605526 -0.95177110

Clustering vector:
  [1] 3 1 3 2 2 3 1 1 1 1 2 1 1 3 2 3 1 2 1 2 2 1 1 3 2 1 1 3 3 1 2 2 1 3 3 3 3
 [38] 1 2 2 3 1 2 2 3 3 1 2 3 2 1 3 1 3 2 2 1 3 2 1 2 1 1 1 3 1 3 2 1 2 1 3 1 3
 [75] 3 1 1 1 1 1 3 1 2 3 1 1 1 3 1 1 3 2 2 1 2 2 3 3 3 3

Within cluster sum of squares by cluster:
[1] 47.27597 31.52213 42.15803
 (between_SS / total_SS =  59.3 %)

Available components:

[1] "cluster"      "centers"      "totss"        "withinss"     "tot.withinss"
[6] "betweenss"    "size"

Here we get some information about the components in the object returned by kmeans(). The $cluster component will yield the membership vector, comparable to the output we saw earlier from cutree():

R> klust$cluster
  [1] 3 1 3 2 2 3 1 1 1 1 2 1 1 3 2 3 1 2 1 2 2 1 1 3 2 1 1 3 3 1 2 2 1 3 3 3 3
 [38] 1 2 2 3 1 2 2 3 3 1 2 3 2 1 3 1 3 2 2 1 3 2 1 2 1 1 1 3 1 3 2 1 2 1 3 1 3
 [75] 3 1 1 1 1 1 3 1 2 3 1 1 1 3 1 1 3 2 2 1 2 2 3 3 3 3

In both instances, notice that I also scale (standardise) the data to allow each variable to be compared on a common scale. With data measured in different "units" or on different scales (as here with different means and variances) this is an important data processing step if the results are to be meaningful or not dominated by the variables that have large variances.

Shawn Mehan
  • 4,513
  • 9
  • 31
  • 51
Gavin Simpson
  • 170,508
  • 25
  • 396
  • 453
  • 4
    @sridher err, load your data into R. There are a plethora of ways one can do that depending on the format your data are in. I think you need to take a step back and read some of the introductory manuals for R, namely "An Introduction to R" and the "R Data Import/Export" manual, both available here: http://cran.r-project.org/manuals.html – Gavin Simpson Apr 13 '11 at 11:50
  • My dataset is of csv file....i imported it into console using this function > data1 <- read.csv(file.choose(), header = TRUE) now data1 is my dataset...from this point i'm unable to do....plz can u explain mentioning this data1 variable so that i could get clusters... – sridher Apr 13 '11 at 11:56
  • sorry for troubling u...but my head just given the huge dataset and asked me to do it in 2 days :-( ....but i'm completely new to this...plz dont mind for asking silly questions...but for me not silly ! – sridher Apr 13 '11 at 11:58
  • So in my code, `dat` plays the role of your `data1`. So look at my code, and replace `dat` with `data1` in all the function calls. Now whether this will work or not will depend on what types of data are in your `data1` and as I don't have `data1` I can't say whether the code will work with your data or not. – Gavin Simpson Apr 13 '11 at 11:59
  • @sridher No trouble, I'm just being honest. I've shown you exactly the code you need to run a *k*-means cluster analysis in R. But if you don't know enough R to use it, this website is not the appropriate venue for getting the assistance you need. If I were you, I'd spend a day learning some R, and then day 2 doing the cluster analysis. – Gavin Simpson Apr 13 '11 at 12:01
  • Haha thank u so much mate...i wil do it now and wil check :-) – sridher Apr 13 '11 at 12:05
  • mate u have given 3 rows and 3 columns....what about those what ro replace there in c ( ) function??.....n ncol = 3...but for my dataset ncol =20 ! so wat about this modification? – sridher Apr 13 '11 at 12:20
  • @sridher - no, you just need the three lines of code immediately after "For k-means, we would do this" in my answer above. Also, as my data are in object `dat` but your data are in `data1`, you need to change the code to use `data1` and not `dat`. The code at the top was just to generate some dummy example data with which to illustrate some of the clustering functions in R. – Gavin Simpson Apr 13 '11 at 12:23
  • so what, is cluster analysis just an easy way to make really really nicely formatted NCAA brackets? Can R fill out my bracket now too? – Chase Apr 13 '11 at 12:51
  • @Chase R can do anything - you should know that ;-) – Gavin Simpson Apr 13 '11 at 12:53
  • 33
    This is the highest answer/question quality ratio I've seen in a while. – Bill the Lizard Apr 13 '11 at 12:59
  • @Gavin Here's my other +1 :-) – chl Apr 16 '11 at 08:10
  • wow, in relation to question that is THE best answer I've seen here. @Bill, really got more of those? I haven't been around for too long – I haven't see a ratio any better than this. – Matt Bannert Oct 25 '11 at 20:05
  • Is scale() necessary if all my variables are in the same units but might have different means and variances? – Herman Toothrot Oct 18 '18 at 10:41
  • @HermanToothrot It depends on whether you want the big/abundant things (the things with higher means) to dominate, assuming you're using the Euclidean distance. Other distances are available which may have implicit standardisations so it does depend. – Gavin Simpson Oct 18 '18 at 16:17