I started with a set of points from a laser scan which I plotted as a scatter plot using matplotlib. I then used plt.savefig to be able to open the plot as an image and use openCV to find contours around the points. Now, I want to be able to find the centers of the contours and plot them as points in the original scatter plot. The problem is I don't know how to create a mapping between the original scatter plot points and the image pixels. Is there a way to do this? Or another way to mark the center of the contours in matplotlib?
Note: the reason I need to draw contours is that later I need to use openCV's matchShapes function to compare the contours.
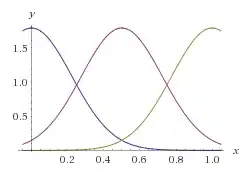
Here are the images from each step:
scatter plot
 ,
,
contours with centers marked in red

Now I basically want to be able to add the red markings from the image to the scatter plot.
Here is my code:
    plt.scatter(X[:,0], X[:,1], s=2)
    plt.axis('equal')
    plt.axis('off')
    plt.savefig(name)
    plt.clf()
    img = cv2.imread(name)
    imgGray = cv2.cvtColor(img, cv2.COLOR_BGR2GRAY)
    ret, thresh = cv2.threshold(imgGray, 127, 255, 0)

    im2, contours, hierarchy = cv2.findContours(thresh, cv2.RETR_TREE, cv2.CHAIN_APPROX_SIMPLE)

    height = img.shape[0]
    width = img.shape[1]
    blank_image = np.zeros((height,width,3), np.uint8)

    cv2.drawContours(blank_image, contours, -1, (255,0,0))

    for contour in contours:
        M = cv2.moments(contour)
        cX = int(M["m10"] / M["m00"])
        cY = int(M["m01"] / M["m00"])
        cv2.circle(blank_image, (cX, cY), 2, (0, 0, 255), -1)
    cv2.imwrite(name, blank_image)
UPDATE: Based on suggestions I looked at matplot's transforms function and tried the following:
fig = plt.figure()
ax = fig.add_subplot(111)
ax.plot(x_coords, y_coords, 'bo', markersize=2)
ax.axis('equal')
ax.axis('off')
height1 = fig.get_figheight()*fig.dpi
width1 = fig.get_figwidth()*fig.dpi
inv = ax.transData.inverted()

plt.savefig('img.png')

img = cv2.imread('img.png')
imgGray = cv2.cvtColor(img, cv2.COLOR_BGR2GRAY)
ret, thresh = cv2.threshold(imgGray, 127, 255, 0)
im2, contours, hierarchy = cv2.findContours(thresh, cv2.RETR_TREE, cv2.CHAIN_APPROX_SIMPLE)

height = img.shape[0]
width = img.shape[1]
blank_image = np.zeros((height,width,3), np.uint8)

centers_x = []
centers_y = []

for contour in contours:
    M = cv2.moments(contour)
    cX = int(M["m10"] / M["m00"])
    cY = int(M["m01"] / M["m00"])

    centers_x.append(inv.transform((cX, height1-cY))[0])
    centers_y.append(inv.transform((cX, height1-cY))[1])

    cv2.drawContours(blank_image, [contour], -1, (255,0,0),1)
    cv2.circle(blank_image, (cX, cY), 2, (0, 0, 255), -1)

cv2.imwrite("test.png", blank_image)

ax.plot(centers_x, centers_y, 'ro', markersize=4)

plt.show()
This got me close but it seems like the x coordinates are still slightly off
new result]
 .
.
I also tried
centers_x.append(inv.transform((width1-cX, height1-cY))[0])
centers_y.append(inv.transform((width1-cX, height1-cY))[1])
but that also didn't work.
FINAL UPDATE: adding
plt.tight_layout()
solved the problem.
