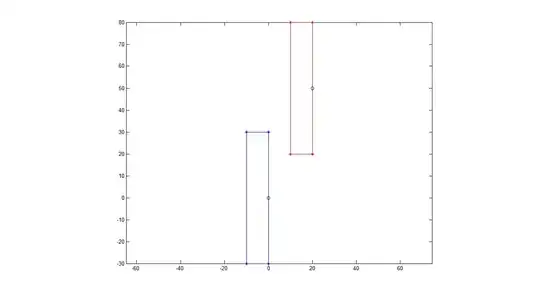
 I'd like to mark a number on the x-axis of a plot in R. For example, circle or highlight the number. Any idea of how to do it?
I was thinking of plotting a circle with a transparent background on the current plot. However, I couldn't find a way to do it right and exactly place it on the number I want which is below the x-axis.
Any help is appreciated!
