7

I am trying to generate a one-dimensional graph that looks like a progress bar in that it gets filled up depending on which percentile a subject falls in.

enter image description here

I have the percentile as a numerical value, just don't know how to graph it to look look like a horizontal bar that is filled according to the percentile (0-100).

user3542212
  • 111
  • 5
  • 1
    Related [Create bar chart on top of totals with ggplot2](https://stackoverflow.com/questions/48118808/create-bar-chart-on-top-of-totals-with-ggplot2) – pogibas Jul 04 '19 at 10:30
  • I am not sure if this can be marked as a duplicate as linked question is very specific. This is a very nice question and there's nothing on SO about making progress bars in `ggplot2` – pogibas Jul 04 '19 at 10:40

2 Answers2

6

Here is something that might get you started.

First off, let's generate some minimal sample data

df <- data.frame(
    Extraversion = 12,
    Intraversion = 40)

We then reshape the data and add a total 100% column

library(tidyverse)
df <- df %>%
    gather(key, val) %>%
    mutate(
        key = factor(key, rev(unique(key))),
        Total = 100)

We define a convenience function that produces the text inside the "progress bar"

format_value <- function(key, val) {
    qual <- c("very low", "low", "average", "high", "very high", "max")
    sprintf(
        "%s - %ith percentile - %s",
        key, val, qual[findInterval(val, seq(0, 100, by = 20))])
}

Now we're ready to plot

ggplot(df, aes(key, val)) +
    geom_col(fill = "forestgreen") +
    geom_col(aes(y = Total), alpha = 0.5, colour = "black") +
    geom_text(
        aes(y = 5, label = format_value(key, val)),
        hjust = 0,
        fontface = "bold",
        colour = "white") +
    coord_flip() +
    theme_minimal() +
    theme(
        axis.title = element_blank(),
        axis.text = element_blank(),
        axis.ticks = element_blank(),
        panel.grid.major = element_blank(),
        panel.grid.minor = element_blank(),
        panel.background = element_blank())
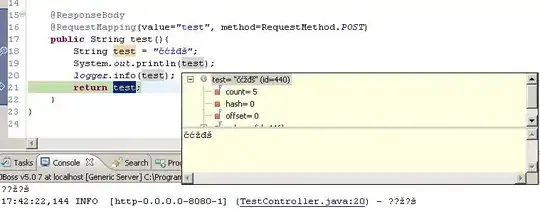
enter image description here

Maurits Evers
  • 49,617
  • 4
  • 47
  • 68
  • 3
    Nice generalization and effort to reproduce the example plot. However, since the explicit question was much narrower, I fear the elementary components for just making a horizontal partly-filled bar might get lost in all the other details for an inexperienced user. – Mikko Marttila Jul 04 '19 at 12:26
  • an inexperienced user can better refer to @MikkoMarttila 's answer – Kay Sep 12 '21 at 12:44
3

Minimally, you can plot a total bar, overlay the percentile bar, and then turn the plot horizontally:

library(ggplot2)

percentile <- 12

ggplot() +
  geom_col(aes("", 100)) +
  geom_col(aes("", percentile), fill = "forestgreen") +
  coord_flip()

Created on 2019-07-04 by the reprex package (v0.3.0)

Mikko Marttila
  • 10,972
  • 18
  • 31
  • how to get the barplot being narrower ( in y direction)? but at the same time not having so much white space at the to and bottom of the graph? – yuliaUU May 27 '20 at 21:29
  • 1
    you can reduce the width of the bar by `width` parameter e.g. `geom_col(aes("", 100), width = 0.2, fill = 'lightpink1')` To resize the plot use `x11` e.g. `x11(width = 3, height =2)`. See https://stackoverflow.com/questions/1279003/specify-width-and-height-of-plot – Kay Sep 12 '21 at 12:42