3

I am trying to plot several plots of "state sequence object" created with the TraMineR package using the plot_grid() function. My main problem is, that I can not store the plots created with the seqplot() function in a list. My problem is not about how to position the legend or "sub"plots but about how to actually plot the seqplots in a grid.

I stored ggscatter plots in a list and passed that list to the plot_grid() function before - so I am relatively sure that this works in general. I think the problem is mainly the object type produced by seqplot(). I tried to store the plots using the as.ggplot() function, which did not work (example A below).

Using the recordPlot() function works more or less. It does not look nice though (example B + C below).

library(TraMineR)
library(ggplotify)

data(biofam)
biofam.lab <- c("Parent", "Left", "Married", "Left+Marr",
                "Child", "Left+Child", "Left+Marr+Child", "Divorced")
biofam.seq <- seqdef(biofam[1:600,], 10:25, labels=biofam.lab)

# Example A ---------------------------------------------------------------

# not even able to store the plot
plot.list <- list()
plot.list[[1]] <- as.ggplot(seqplot(biofam.seq, type = "I", with.legend = FALSE, sortv = "from.start"))

# Example B and C ---------------------------------------------------------

plot.list <- list()
seqplot(biofam.seq, type = "I", with.legend = FALSE, sortv = "from.start")
plot.list[[1]] <- recordPlot()
seqplot(biofam.seq, type = "I", with.legend = FALSE, sortv = "from.start")
plot.list[[2]] <- recordPlot()
seqplot(biofam.seq, type = "I", with.legend = FALSE, sortv = "from.start")
plot.list[[3]] <- recordPlot()
seqplot(biofam.seq, type = "I", with.legend = FALSE, sortv = "from.start")
plot.list[[4]] <- recordPlot()

# Example B

plot_grid(plotlist = plot.list, ncol = 2)

# Example C

plot_grid(
  plot_grid(plotlist = plot.list, ncol = 2),
  plot_grid(plotlist = plot.list, ncol = 2)
)

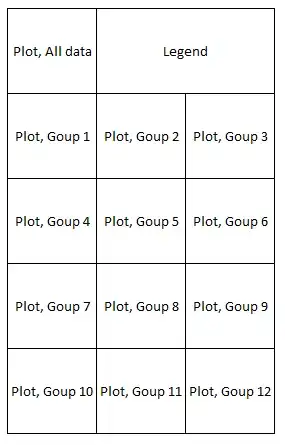
I want to be relatively free in positioning the actual elements I want to plot in a grid. For example, I want to save a page containing 13 such plots and a legend in a 5 x 3 grid - as can be seen in the example. That's why I think going with plot_grid() works better compared to, e.g., par(mfrow = c(5,3)). Additionally, using par() I get "Error in plot.new() : figure margins too large".

Example of plot grid

MLud
  • 43
  • 6
  • Possible duplicate of [Shift legend into empty facets of a faceted plot in ggplot2](https://stackoverflow.com/questions/54438495/shift-legend-into-empty-facets-of-a-faceted-plot-in-ggplot2) – M-- Jul 09 '19 at 20:06
  • @M-M I don't think it's a duplicate, as my problem is not about positioning the elements in the grid but actually getting the elements plotted in the grid. – MLud Jul 09 '19 at 20:18
  • Sorry, I did not understand the difference you pointed out in your comment. Would you elaborate? – M-- Jul 09 '19 at 20:19
  • In my skimming of the [ggplotify vignette](https://cran.rstudio.com/web/packages/ggplotify/vignettes/ggplotify.html) it looked like `as.ggplot()` often involves using `expression()` or `function()` or `~` (at least if the plot is based on base). – aosmith Jul 09 '19 at 20:21
  • If you haven't seen it already, [this article](https://wilkelab.org/cowplot/articles/mixing_plot_frameworks.html) on mixing different plotting frameworks with **cowplot** may be useful. – aosmith Jul 09 '19 at 20:24
  • @M-M I am able to store several ggplots in a list and pass this list to plot_grid(). But I am not able to do that the plots created by the seqplot() function. – MLud Jul 09 '19 at 20:25
  • @aosmith thank you - have seen the article but indeed overlooked the `expression()` and `function()` part. Will try that! – MLud Jul 09 '19 at 20:28
  • `Error in as.ggplot(seqplot(biofam.seq, type = "I", with.legend = FALSE, : could not find function "as.ggplot"` – IRTFM Jul 09 '19 at 21:07

1 Answers1

4

seqplot internally uses base plot. Therefore plotting multiple graphs would work better with layout. You just make a layout matrix and plot one plot after another. The legend seqlegend can also be treated as a plot. Here an example with your data and four plots with a legend.

layout(matrix(c(1, 2, 2, 3:5), ncol=3, byrow=TRUE))
layout.show(5)  # this line is just to get the preview below where the plots will be placed

enter image description here

seqplot(biofam.seq, type="I", with.legend=FALSE, sortv="from.start")
seqlegend(biofam.seq, cex=.9, ncol=5, position="bottom")  # legend
seqplot(biofam.seq, type="I", with.legend=FALSE, sortv="from.start")

Yields

enter image description here

Of course, to get dimensions right, use e.g. pdf or png device, as it is well explained in this answer.

jay.sf
  • 60,139
  • 8
  • 53
  • 110
  • 1
    Layout did the trick! Thank you. When using the `seqlegend` function provided in the `TraMineR` package to plot the legend `plot.new()` is not needed/will result in a plot with the legend in an unintended place. – MLud Jul 10 '19 at 08:02
  • @MLud You are welcome. Thanks, I just remembered there's actually a `seqlegend` function included in `TraMineR` which is even more convenient. Updated. – jay.sf Jul 10 '19 at 08:10