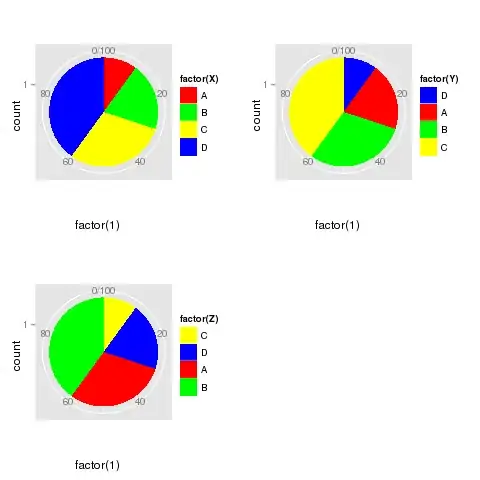
The grid/viewport approach would work something like this. First we arrange some data to match what you show. We rotate the levels of the factor for each of X, Y and Z as you specify in the question
## Your data
dat <- data.frame(X = factor(rep(LETTERS[1:4], times = c(10,20,30,40)),
                             levels = LETTERS[1:4]),
                  Y = factor(rep(LETTERS[1:4], times = c(20,30,40,10)),
                             levels = LETTERS[c(4,1:3)]),
                  Z = factor(rep(LETTERS[1:4], times = c(30,40,10,20)),
                             levels = LETTERS[c(3:4,1:2)]))
Next we produce the individual pie plots, rotating the same scale_fill_manual() colours in the same order we rotated the levels in the data, dat (with apologies for the nasty colours - how does one get the first n colours that ggplot would use normally?):
p1 <- ggplot(dat, aes(x = factor(1), fill = factor(X))) +
          geom_bar(width = 1) + coord_polar(theta = "y") +
          scale_fill_manual(value = c("red","green","yellow","blue"))
p2 <- ggplot(dat, aes(x = factor(1), fill = factor(Y))) +
          geom_bar(width = 1) + coord_polar(theta = "y") +
          scale_fill_manual(value = c("red","green","yellow","blue")[c(4,1:3)])
p3 <- ggplot(dat, aes(x = factor(1), fill = factor(Z))) +
          geom_bar(width = 1) + coord_polar(theta = "y") +
          scale_fill_manual(value = c("red","green","yellow","blue")[c(3:4,1:2)])
Now we need a new plotting page and to push onto it a 2x2 layout:
grid.newpage()
pushViewport(viewport(layout = grid.layout(2,2)))
A custom function allows us to simplify setting the row/col for each subsequent plot:
vplayout <- function(x, y) {
    viewport(layout.pos.row = x, layout.pos.col = y)
}
Next we simply plot each save ggplot object on the correct viewport, as specified by argument vp:
print(p1, vp = vplayout(1,1))
print(p2, vp = vplayout(1,2))
print(p3, vp = vplayout(2,1))
The above grid code was taken from page 94 in Hadley's excellent book on ggplot.
This produces: