0

I have a web application which converts some PCL files to PDF by running a scheduler task every 10 seconds. Each time it takes max. 20 pc files from a directory and convert them to pdf.

First few tasks run nice but step by step it gets slower and suddenly a GC overhead limit exceeded error message is raised.

I've tried to analyze this memory leak with VisualVM and here is some output from the heapdump:enter image description here

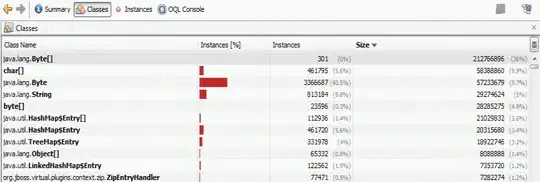
It's strange that such amount of bytes instances (3.366.687 !!!) it's shown. In the application I also have Streams and I really checked to see if all this streams are closed when their related operations are done.

I use byte in a single class in three methods : byte[] buf = new byte[1024];

 public void initBuf() {
        if (buf != null) {
            for (int i = 0; i < buf.length; i++) {
                buf[i] = (byte) 0x00;
            }

            pdf_y = PageSize.A4.getHeight();
        }
    }

public void appendBuf(char ch) {

        if (ch == '\n') {
            processChunk();
            drawChunks();
            pdf_newline();
        } else if (ch != '\r') {
            buf[buf_index++] = (byte) (0xff & ch);
        }
    }

    public void resetBuf() {
        for (int i = buf_index; i >= 0; i--) {
            buf[i] = (byte) 0x00;
        }

        buf_index = 0;
    }

Where would you advice me to look? How can I really identify which of my code is doing this harmfull?

I cannot post all the code because there are more classes which do this conversion but I really hope you to help me with some advices becauise I spent a lot of time and still this memory issue persists.

Thanks in advance

Cristian Boariu
  • 9,603
  • 14
  • 91
  • 162
  • what have you tried? (it's possible you could see some improvements by aggressively nulling the loitering large byte arrays that you're asking for whenever you're done with them) – Joseph Weissman Apr 19 '11 at 19:30

2 Answers2

2

Your profiler screen-shot shows 3.3 million instances of java.lang.Byte, not of byte[]. I'd look elsewhere for usage of Byte (possibly including instances that were auto-boxed from byte to insert them into a Collection).

My first suspicion is that some other part of your code is adding Byte or byte instances to a map (either as the key or as the value) and failing to remove them when they are no longer needed. But that's just a guess based on tracking down a few memory leaks of my own.

AaronD
  • 1,701
  • 13
  • 12
  • At least if I could find in VM which is the Class which does this stuff with bytes... – Cristian Boariu Apr 19 '11 at 20:15
  • Also note that you have 301 instances of Byte[], collectively consuming 212 MB of memory. You might search your code for references to Byte[], or trace back through references to those Byte[] arrays in VisualVM. – AaronD Apr 19 '11 at 20:42
1

Take a look at VisualVM guides on working with heap dumps: here's Oracle's.

You might also look for NetBeans references, since the component is the same, e.g. How do you find memory leaks using the Netbeans profiler?

You need to know who creates or retains references to those Byte[]s and Bytes. One plan of attack would be to examine individual Byte[] instances ("Instances View") and look at their references. The "Nearest GC Root" option will show one path of objects that retains the lingering Byte[].

Community
  • 1
  • 1
Michael Brewer-Davis
  • 14,018
  • 5
  • 37
  • 49
  • The problem is that if I press on a byte[] instance I see references in the right side but I only see [] (Array type) and o (Object Type) and no GC root arrow for my vars... – Cristian Boariu Apr 19 '11 at 21:12
  • "Show Nearest GC Root" is an option the right-click context menu. If there is no GC root, it should mean that the object is eligible for GC. – Michael Brewer-Davis Apr 19 '11 at 22:55