3

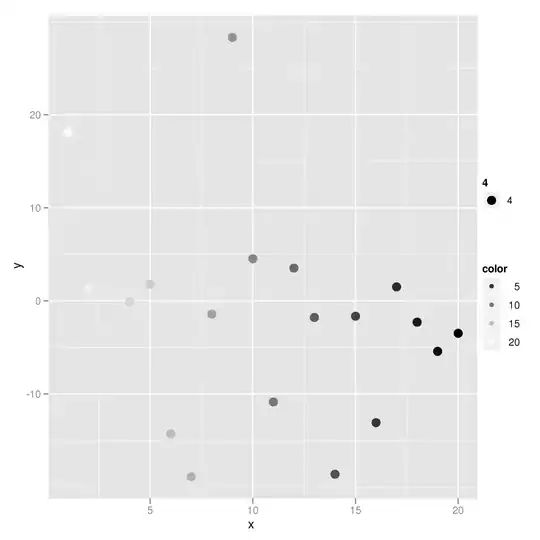
I have a large grid formed by X and Y coordinates, each representing a value. However, some combinations within the grid do not exist, see the attached graphic: grid with missing combinations

I would like to identify the missing x-y-combinations with a R script, however don't know how to do this. What's an efficient of getting these combinations?

Example of my data:

df1 <- structure(list(coord_n = c(1065125L, 1065875L, 1064625L, 1064375L, 
    1065625L, 1065375L, 1065625L, 1065125L, 1065625L, 1065125L, 1066125L, 
    1064625L, 1066375L, 1064125L, 1064375L, 1064625L, 1066375L, 1064875L, 
    1066125L, 1066625L, 1064375L, 1065125L, 1066375L, 1066625L, 1065125L, 
    1065875L, 1064125L, 1064375L, 1064125L, 1065875L, 1064625L, 1065125L, 
    1065125L, 1065625L, 1066375L, 1064375L, 1064875L, 1065875L, 1066375L, 
    1066625L, 1064375L, 1064625L, 1066375L, 1065875L, 1065375L, 1065375L, 
    1066625L, 1065375L, 1064625L, 1066625L, 1066125L, 1065625L, 1065375L, 
    1065875L, 1064125L, 1064375L, 1064875L, 1065625L, 1065625L, 1064625L, 
    1064875L, 1065375L, 1065875L, 1065875L, 1066625L, 1065875L, 1064875L, 
    1066625L, 1064875L, 1064125L, 1066125L, 1064375L, 1066375L, 1064125L, 
    1066625L, 1065125L, 1064625L, 1065625L, 1066125L, 1064125L, 1066375L, 
    1066625L, 1066375L, 1064125L, 1064875L, 1065375L, 1064375L, 1065625L, 
    1065875L, 1065375L, 1066375L, 1064875L, 1064375L, 1066625L, 1064375L, 
    1065875L, 1064375L, 1065375L, 1064875L, 1066375L), coord_e = c(2418625L, 
    2419125L, 2421875L, 2418125L, 2421375L, 2422375L, 2421125L, 2418875L, 
    2418625L, 2420375L, 2419375L, 2420625L, 2418875L, 2420625L, 2419125L, 
    2420875L, 2419125L, 2419875L, 2418375L, 2421625L, 2422375L, 2422375L, 
    2422125L, 2422125L, 2420125L, 2421875L, 2421875L, 2420125L, 2422375L, 
    2420625L, 2419625L, 2418375L, 2419625L, 2418375L, 2419875L, 2420875L, 
    2421375L, 2422375L, 2422375L, 2418125L, 2418375L, 2419125L, 2418625L, 
    2418875L, 2419375L, 2421375L, 2421125L, 2419125L, 2418375L, 2419625L, 
    2418875L, 2420125L, 2419875L, 2420375L, 2420375L, 2419875L, 2420375L, 
    2422375L, 2421875L, 2422375L, 2419375L, 2420875L, 2421125L, 2421375L, 
    2419125L, 2419375L, 2421625L, 2418375L, 2418875L, 2418375L, 2420125L, 
    2419625L, 2418375L, 2420125L, 2421375L, 2422125L, 2419875L, 2420375L, 
    2420375L, 2418625L, 2421125L, 2420125L, 2421625L, 2419875L, 2419125L, 
    2420625L, 2418625L, 2419375L, 2420125L, 2418125L, 2420125L, 2418625L, 
    2418875L, 2418625L, 2421125L, 2419875L, 2421375L, 2418875L, 2420875L, 
    2421875L), density_value = c(0L, 0L, 0L, 0L, 0L, 0L, 0L, 0L, 
    0L, 0L, 0L, 0L, 0L, 0L, 0L, 0L, 0L, 0L, 0L, 0L, 0L, 0L, 0L, 0L, 
    0L, 0L, 0L, 0L, 0L, 0L, 0L, 0L, 0L, 0L, 0L, 0L, 0L, 0L, 0L, 0L, 
    0L, 0L, 0L, 0L, 0L, 0L, 0L, 0L, 0L, 0L, 0L, 0L, 0L, 0L, 0L, 0L, 
    0L, 0L, 0L, 0L, 0L, 0L, 0L, 0L, 0L, 0L, 0L, 0L, 0L, 0L, 0L, 0L, 
    0L, 0L, 0L, 0L, 0L, 0L, 0L, 0L, 0L, 0L, 0L, 0L, 0L, 0L, 0L, 0L, 
    0L, 0L, 0L, 0L, 0L, 0L, 0L, 0L, 0L, 0L, 0L, 0L), percentage_free = c(100, 
    100, 100, 100, 100, 100, 100, 100, 100, 100, 100, 100, 100, 100, 
    100, 100, 100, 100, 100, 100, 100, 100, 100, 100, 100, 100, 100, 
    100, 100, 100, 100, 100, 100, 100, 100, 100, 100, 100, 100, 100, 
    100, 100, 100, 100, 100, 100, 100, 100, 100, 100, 100, 100, 100, 
    100, 100, 100, 100, 100, 100, 100, 100, 100, 100, 100, 100, 100, 
    100, 100, 100, 100, 100, 100, 100, 100, 100, 100, 100, 100, 100, 
    100, 100, 100, 100, 100, 100, 100, 100, 100, 100, 100, 100, 100, 
    100, 100, 100, 100, 100, 100, 100, 100)), class = c("data.table", 
    "data.frame"), row.names = c(NA, -100L))
M--
  • 25,431
  • 8
  • 61
  • 93
Mario
  • 2,393
  • 2
  • 17
  • 37
  • 1
    Remove ```.internal.selfref = ``` from `dput` ... https://stackoverflow.com/questions/25533332/cannot-use-dput-for-data-table-in-r – M-- Jul 29 '19 at 15:56
  • What's the resolution of your grid? – M-- Jul 29 '19 at 16:01
  • Each cell is 250m by 250m – the coordinates represent the center point. – Mario Jul 29 '19 at 16:01
  • 1
    so if one grid starts at (bottom-left point) `(1065125, 2418625)` the one to the right and below (southeast cell, for instance) is `(1065375, 2418875)`? – M-- Jul 29 '19 at 16:03
  • No, this would be 1065375 / 2418875. It is always 250 meters between two points. – Mario Jul 29 '19 at 16:06

3 Answers3

5

Assuming that every unique coord_n and coord_e is feasible, this method finds every combination of unique values not found in the original data.

allpossible <- do.call(CJ, lapply(df1[, c("coord_n", "coord_e")], unique))
allpossible
#      coord_n coord_e
#   1: 1064125 2418125
#   2: 1064125 2418375
#   3: 1064125 2418625
#   4: 1064125 2418875
#   5: 1064125 2419125
#  ---                
# 194: 1066625 2421375
# 195: 1066625 2421625
# 196: 1066625 2421875
# 197: 1066625 2422125
# 198: 1066625 2422375

We'll take all possible combinations and do an anti-join on the original data:

print(allpossible[!df1, on = c("coord_n", "coord_e")], nrows = 10)
#     coord_n coord_e
#  1: 1064125 2418125
#  2: 1064125 2418875
#  3: 1064125 2419125
#  4: 1064125 2419375
#  5: 1064125 2419625
# ---                
# 94: 1066625 2420375
# 95: 1066625 2420625
# 96: 1066625 2420875
# 97: 1066625 2421875
# 98: 1066625 2422375

Demo that it works:

A plot of the data as-is (left) and with the "missing" points in red (right):

library(ggplot2)
ggplot(df1, aes(coord_n, coord_e)) +
  coord_quickmap() + geom_point()
ggplot(df1, aes(coord_n, coord_e)) +
  coord_quickmap() + geom_point() +
  geom_point(data = allpossible[!df1, on = c("coord_n", "coord_e")],
             shape = 1, color = "red", size = 3)

side-by-side of original and missing-data highlighted

(If there were any within allpossible that should not have been, we'd see it as a red circle around a black dot: demo of incorrect plot)

r2evans
  • 141,215
  • 6
  • 77
  • 149
  • 1
    and also `allpossible <- setDT(df1)[, CJ(coord_n, coord_e, unique=TRUE)]` for generating all combinations – chinsoon12 Jul 30 '19 at 00:32
5

Here's another approach using dplyr and tidyr to get the missing "pixels":

library(dplyr)
library(tidyr)

df1 %>% 
  expand(coord_n = seq(min(df1$coord_n), max(df1$coord_n), 250), 
         coord_e = seq(min(df1$coord_e), max(df1$coord_e), 250)) %>% 
  anti_join(.,df1)

#> Joining, by = c("coord_n", "coord_e")
#> # A tibble: 98 x 2
#>    coord_n coord_e
#>      <dbl>   <dbl>
#>  1 1064125 2418125
#>  2 1064125 2418875
#>  3 1064125 2419125
#>  4 1064125 2419375
#>  5 1064125 2419625
#>  6 1064125 2420875
#>  7 1064125 2421125
#>  8 1064125 2421375
#>  9 1064125 2421625
#> 10 1064125 2422125
#> # ... with 88 more rows


or in reference to Frank's answer with data.table:

missingDT <- function(DT, cols, defs = NULL){
  require(data.table)
  mDT = do.call(CJ, c(DT[, ..cols], list(unique=TRUE)))
  res = DT[mDT, on=names(mDT)]
  if (length(defs)) 
    res[, names(defs) := Map(replace, .SD, lapply(.SD, is.na), defs), .SDcols=names(defs)]
  res[!complete.cases(res), cols, with=FALSE]
} 

missingDT(setDT(df1), cols = c("coord_n", "coord_e"))

#     coord_n coord_e
# 1:  1064125 2418125
# 2:  1064125 2418875
# 3:  1064125 2419125
# 4:  1064125 2419375
# 5:  1064125 2419625
# ---
# 94: 1066625 2420375
# 95: 1066625 2420625
# 96: 1066625 2420875
# 97: 1066625 2421875
# 98: 1066625 2422375
#     coord_n coord_e
M--
  • 25,431
  • 8
  • 61
  • 93
2

Simple method using table from R base:

subset(
  data.frame(
    table(df1$coord_n, df1$coord_e, dnn = c('coord_n', 'coord_e'))
    ),
  Freq == 0
)[, -3]

#  coord_n coord_e
#1 1064125 2418125
#3 1064625 2418125
#4 1064875 2418125
#5 1065125 2418125
#7 1065625 2418125
#8 1065875 2418125
utubun
  • 4,400
  • 1
  • 14
  • 17