Color thresholding with cv2.inRange() should work here
Here's the main idea
- Convert image to HSV format
- Perform color segmentation with a lower/upper threshold
- Morphological transformations to remove small noise
- Find contours and sum contour area
I'm assuming you want to detect the yellow area. We begin by converting the image to HSV format then use color thresholding with lower/upper ranges of
lower = np.array([33, 0, 238], dtype="uint8")
upper = np.array([135, 189, 255], dtype="uint8")
This results in a segmented mask
Detected yellow regions
From here we perform morphological transformations to remove small noise
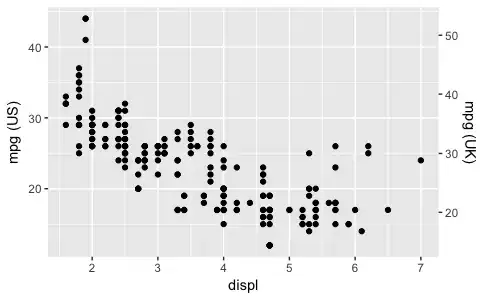
Next we find contours and sum the area with cv2.contourArea(). The detected areas are highlighted in black
Total area
87781.5
import numpy as np
import cv2

# Load image and HSV color threshold
image = cv2.imread('1.jpg')
original = image.copy()
image = cv2.cvtColor(image, cv2.COLOR_BGR2HSV)
lower = np.array([33, 0, 238], dtype="uint8")
upper = np.array([135, 189, 255], dtype="uint8")
mask = cv2.inRange(image, lower, upper)
detected = cv2.bitwise_and(original, original, mask=mask)

# Remove noise
kernel = cv2.getStructuringElement(cv2.MORPH_RECT, (3,3))
opening = cv2.morphologyEx(mask, cv2.MORPH_OPEN, kernel, iterations=1)

# Find contours and find total area
cnts = cv2.findContours(opening, cv2.RETR_EXTERNAL, cv2.CHAIN_APPROX_SIMPLE)
cnts = cnts[0] if len(cnts) == 2 else cnts[1]
area = 0
for c in cnts:
    area += cv2.contourArea(c)
    cv2.drawContours(original,[c], 0, (0,0,0), 2)

print(area)
cv2.imshow('mask', mask)
cv2.imshow('original', original)
cv2.imshow('opening', opening)
cv2.imshow('detected', detected)
cv2.waitKey()
You can use this script to find the color threshold ranges
import cv2
import sys
import numpy as np

def nothing(x):
    pass

useCamera=False

# Check if filename is passed
if (len(sys.argv) <= 1) :
    print("'Usage: python hsvThresholder.py <ImageFilePath>' to ignore camera and use a local image.")
    useCamera = True

# Create a window
cv2.namedWindow('image')

# create trackbars for color change
cv2.createTrackbar('HMin','image',0,179,nothing) # Hue is from 0-179 for Opencv
cv2.createTrackbar('SMin','image',0,255,nothing)
cv2.createTrackbar('VMin','image',0,255,nothing)
cv2.createTrackbar('HMax','image',0,179,nothing)
cv2.createTrackbar('SMax','image',0,255,nothing)
cv2.createTrackbar('VMax','image',0,255,nothing)

# Set default value for MAX HSV trackbars.
cv2.setTrackbarPos('HMax', 'image', 179)
cv2.setTrackbarPos('SMax', 'image', 255)
cv2.setTrackbarPos('VMax', 'image', 255)

# Initialize to check if HSV min/max value changes
hMin = sMin = vMin = hMax = sMax = vMax = 0
phMin = psMin = pvMin = phMax = psMax = pvMax = 0

# Output Image to display
if useCamera:
    cap = cv2.VideoCapture(0)
    # Wait longer to prevent freeze for videos.
    waitTime = 330
else:
    img = cv2.imread(sys.argv[1])
    output = img
    waitTime = 33

while(1):

    if useCamera:
        # Capture frame-by-frame
        ret, img = cap.read()
        output = img

    # get current positions of all trackbars
    hMin = cv2.getTrackbarPos('HMin','image')
    sMin = cv2.getTrackbarPos('SMin','image')
    vMin = cv2.getTrackbarPos('VMin','image')

    hMax = cv2.getTrackbarPos('HMax','image')
    sMax = cv2.getTrackbarPos('SMax','image')
    vMax = cv2.getTrackbarPos('VMax','image')

    # Set minimum and max HSV values to display
    lower = np.array([hMin, sMin, vMin])
    upper = np.array([hMax, sMax, vMax])

    # Create HSV Image and threshold into a range.
    hsv = cv2.cvtColor(img, cv2.COLOR_BGR2HSV)
    mask = cv2.inRange(hsv, lower, upper)
    output = cv2.bitwise_and(img,img, mask= mask)

    # Print if there is a change in HSV value
    if( (phMin != hMin) | (psMin != sMin) | (pvMin != vMin) | (phMax != hMax) | (psMax != sMax) | (pvMax != vMax) ):
        print("(hMin = %d , sMin = %d, vMin = %d), (hMax = %d , sMax = %d, vMax = %d)" % (hMin , sMin , vMin, hMax, sMax , vMax))
        phMin = hMin
        psMin = sMin
        pvMin = vMin
        phMax = hMax
        psMax = sMax
        pvMax = vMax

    # Display output image
    cv2.imshow('image',output)

    # Wait longer to prevent freeze for videos.
    if cv2.waitKey(waitTime) & 0xFF == ord('q'):
        break

# Release resources
if useCamera:
    cap.release()
cv2.destroyAllWindows()