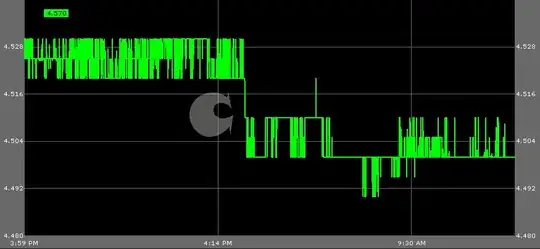
I have chart that can contain a lot of points (10000 +) When I scale the chart in order to see all points in screen, it takes some time to draw them

Can You advice me some optimization, in order not to draw all points
I have chart that can contain a lot of points (10000 +) When I scale the chart in order to see all points in screen, it takes some time to draw them

Can You advice me some optimization, in order not to draw all points
I'm not an expert with listed technologies, but I would solve this by 'bucketing' your data points.
Your X axis is time, so determine the resolution point for the current chart size. IE, if you are seeing the entire chart you will only need a data point per day for example. If you are zoomed in a long way, you might want a point per hour.
Now you have determined resolution, go through your chart, and find all the data that exists between the resolution points, IE, all data that is > 20th April 2011 at 4pm and < 20th April 2011 at 5pm if you are on an hourly resolution.
Depending on the type of data you are using, will determine if you want to average all the data point you have collected, or find the median (or some other method, such as a candle stick chart to show the max/min values). Either way, pick the most relevant method, repeat for all points and render the result with your new data.
Hope that's what you meant.
Seems like you should use some sort of level of detail (LoD) algorithm.
For example: Always use a maximum given set of points to represent all your actual points. By calculating local minima and maxima you can create a proper representation of the given point set for a certain 'detail', depending on how far you are zoomed in.
Calculating these extrema can still prove to be slow, so you might need to cache them. You can calculate and cache this on the fly as new data arrives.
I had experienced a severe performance problem with thousands of Series added to the chart rather than thousands of Points. The solution that worked for me was a flavor of the Flyweight pattern:
At the end of a virtual series, i.e., when all points of the series have been added and it's time to move on to the next one, insert an empty point:
series.Points.Add(new DataPoint(0, 0) { IsEmpty = true });
Hope that helps somebody.
In addition to the other good suggestions, I would
Do some random-pausing on it, to see if it's spending much time doing something else that could be avoided, such as maybe allocating new point structures all the time.
Rather than paint directly to the window, paint to a bitmap, and copy that to the window. It always looks faster, and sometimes it even is faster. (Be sure to stub out the method that clears the window background.)