3

It was around 8-9 years ago I saw a tool for Visual Studio (I don't really remember the name) which can visualize the function calls and their performance. I really liked it so I was wondering if there is anything similar to that in Python. Let's say you have three functions:

def first_func():
    ...

def second_func():
    ...
    for i in xrange(10):
        first_function()
    ...

def third_func():
    ...
    for i in xrange(5):
        second_function()
    ...

So, the final report of that tool was something like this (including connection diagrams):

first_func[avg 2ms] <--50 times--< second_func[avg 25ms] <--5 times--< third_func[avg 140ms]

A tool like this would make it easier to find the bottlenecks into a system. Especially for the large systems.
pocoa
  • 4,197
  • 9
  • 37
  • 45
  • @eat_a_lemon :)) If I can't find something similar, I'll try to implement by myself. Before to start working on it, I just wanted to check if there is anything close to that. – pocoa Apr 21 '11 at 18:08

3 Answers3

5

You could use the profiler bundled with the python installation. Python Profiler Link

Aaron Smith
  • 178
  • 7
  • Yeah, it's useful but its report doesn't provide any information about the relations of the functions, you need to figure it out by yourself. – pocoa Apr 21 '11 at 18:35
  • 1
    @pocoa: True, but getting the metrics is the hard part. From there you could write your own Python script that would allow you pick out the data for the functions you wanted to compare. I think you will be hard pressed to find a tool that will automatically compare 'magic' functions. I say 'magic' because only you know what functions of similar logic you want to compare. – Aaron Smith Apr 21 '11 at 19:10
2

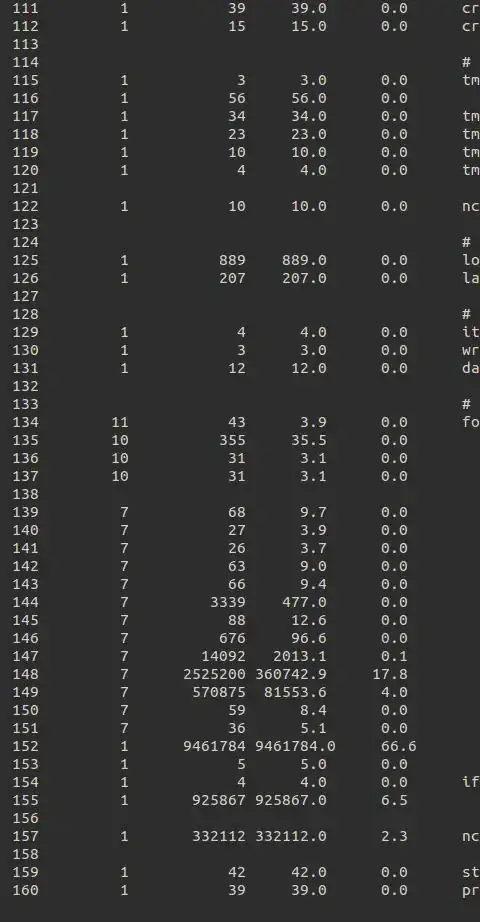
Line-by-line timing and execution frequency with a profiler:

First, install line_profiler

Second, modify your source code by decorating the function you want to measure with the @profile decorator.

Third, kernprof -l -v yourscript.py

The -l option tells kernprof to inject the @profile decorator into your script’s builtins, and -v tells kernprof to display timing information once you’re script finishes.

output:

enter image description here

MK83
  • 1,652
  • 1
  • 11
  • 11
1

It is common to think what you need to know is how many times things are called, how much time they take (self vs. inclusive), and who-calls-who how much of the time. Then you can put on your detective's cap and hopefully sleuth out where the problem is.

There is another approach, which is to ask, not about functions, but lines of code, what percent of the wall-clock time they are on the stack. The reason is, if such a line of code could be made to take no time, by avoiding it or deleting it or doing it's job differently, that percent is how much could be saved. You don't have to be a detective to pinpoint it. Any bottleneck in your code has to appear as such a line, and the precise percent is not important. Here's an example.

Community
  • 1
  • 1
Mike Dunlavey
  • 40,059
  • 14
  • 91
  • 135