0

I have three different subplotts, each with their own legend. I want to combine each of these 3 legends into one common legend at the bottom of the plot. I have found many similar questions combining the legends of different sub plots into one common legend when all the subplots had the same legend. Yet, not when the legends are different. Attempts to change the code were not succesful.

grid_arrange_shared_legend <- function(...) {
  plots <- list(...)
  g <- ggplotGrob(plots[[1]] + theme(legend.position = "bottom"))$grobs
  legend <- g[[which(sapply(g, function(x) x$name) == "guide-box")]]
  lheight <- sum(legend$height)
  grid.arrange(
    do.call(arrangeGrob, lapply(plots, function(x)
      x + theme(legend.position="none"))),
  legend, 
  ncol = 1, 
  heights = unit.c(unit(1, "npc") - lheight, lheight))
}
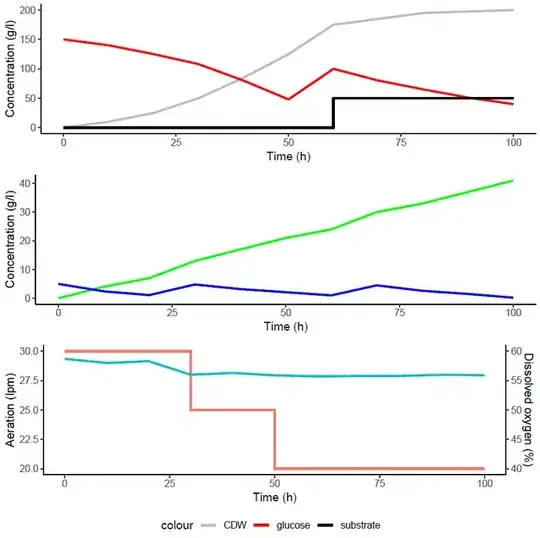
data = read.table("fermentation_run.csv", header=TRUE, sep=",", fileEncoding="UTF-8-BOM") 
p1 <- ggplot(data, aes(x = time)) + 
  geom_line(aes(y = cdw*5, colour = "CDW"), size=1) + 
  geom_line(aes(y = glucose, colour = "glucose"), size=1) + 
  geom_step(aes(y = substrate, colour = "substrate"), size=1) + 
  theme_classic() + ylab("Concentration (g/l)") + 
  xlab("Time (h)") + 
  scale_colour_manual(values = c("grey", "red", "black"))
  theme(legend.position="bottom", legend.title=element_blank())

p2 <- ggplot(data, aes(x=time)) + 
  geom_line(aes(y = alkyl, colour = "alkyl SS"), size=1) + 
  geom_line(aes(y = oleyl, colour = "oleyl alcohol"), size=1) + 
  theme_classic() + 
  xlab("Time (h)") + 
  ylab("Concentration (g/l)") + 
  scale_colour_manual(values = c("green", "blue"))
  theme(legend.position="bottom", legend.title=element_blank())

p3 <- ggplot(data, aes(x=time)) + 
  geom_step(aes(y = aeration, colour="aeration"), size=1) + 
  geom_line(aes(y = do/2, colour="dissolved oxygen"), size=1) +
  theme_classic() + 
  xlab("Time (h)") + 
  ylab("Aeration (lpm)") + 
  scale_y_continuous(sec.axis = sec_axis(~.*2, name = "Dissolved oxygen (%)")) + 
  theme(legend.position="bottom", legend.title=element_blank())

grid_arrange_shared_legend(p1, p2,p3)

This returns only the legend of the first plot and not of the three plots combined.

Nicolas
  • 89
  • 1
  • 8
  • https://stackoverflow.com/questions/13649473/add-a-common-legend-for-combined-ggplots – Adam Quek Aug 17 '19 at 15:56
  • All these examples always have the same legend in each subplot. I know how to combine that into 1 legend. Yet, I have different legends in my subplots and the solutions proposed do not work. Thanks for the tip though. – Nicolas Aug 17 '19 at 16:00
  • I would try to trick the first plot to have all legend. If you provide some data, others might be able to help. Also, since those plots have completely different legends, wouldn't be better to have a legend specifically for each plot? – Zhiqiang Wang Aug 17 '19 at 16:25

2 Answers2

1

I don't have your data so I'll illustrate it with some basic datasets. The method isn't perfect with respect to some whitespace around the legends, but maybe someone in the comments knows a solution.

The answer I'm proposing is getting dirty with gtables and patchwork and internal functions thereof.

library(ggplot2)
library(grid)
library(patchwork) #https://github.com/thomasp85/patchwork

# Make plots as usual
g1 <- ggplot(iris, aes(Sepal.Width, Sepal.Length)) +
  geom_point(aes(colour = Species))

g2 <- ggplot(mtcars, aes(mpg, disp)) +
  geom_point(aes(colour = as.factor(cyl)))


# specify a legend position and a orientation for plots
position <- "bottom"
orientation <- "vertical"

# Add as many plots as you want to this list
plots <- list(g1, g2)

# Grab legends from plots in list
legends <- lapply(plots, function(p) {
  p <- ggplotGrob(p + theme(legend.position = position))$grobs
  p[[which(sapply(p, function(x) x$name) == "guide-box")]]
})

# Combine the legends
legend <- switch(position,
                 "bottom" = do.call(gtable:::cbind.gtable, legends),
                 "right" = do.call(gtable:::rbind.gtable, legends))

# Now make versions of the plots without the legend
stripped <- lapply(plots, function(p) p + theme(legend.position = "none"))

# Combine all the plots
stripped <- switch(orientation,
                   "horizontal" = do.call(patchwork:::ggplot_add.ggplot, stripped),
                   "vertical"   = do.call(patchwork:::`/.ggplot`, stripped))

# Combine plots with legend
out <- switch(position,
              "bottom" = stripped / legend,
              "right" = stripped + legend)
out

Created on 2019-08-17 by the reprex package (v0.3.0)

If the whitespace really is a problem, you could supply a plot layout, but this would have to be a manual judgement to make:

out + plot_layout(heights = c(1,1,0.2))

enter image description here

teunbrand
  • 33,645
  • 4
  • 37
  • 63
1

I think the key is to add all the legends in your first plot. To achieve this, you could add some fake rows in your data and label them according to your legends for all plots. Let's assume those legends are "a", "b", "c", "d", "e", and "f" in the following:

library(tidyverse)
# insert several rows with values outside your plot range
data <- add_row(mtcars,am=c(2, 3, 4, 5), mpg = 35, disp = 900)
data1<-data %>% 
  mutate (
   by1 = factor(am, levels = c(0, 1, 2, 3, 4, 5), 
             labels = c("a", "b","c","d", "e","f")))
p1 <- ggplot(data1, aes(x = mpg, y=disp, col=by1)) + 
  geom_point() +
  ylim(50,500) 

You will get all the legends you need, and grid_arrange_shared_legend(p1, p2,p3) will pick up this. As you can see only "a" and "b" are for the first plot, and the rest are for other plots.

enter image description here

Zhiqiang Wang
  • 6,206
  • 2
  • 13
  • 27