3

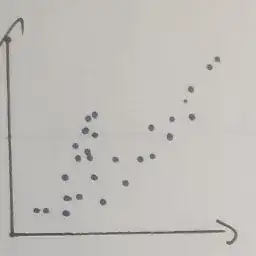
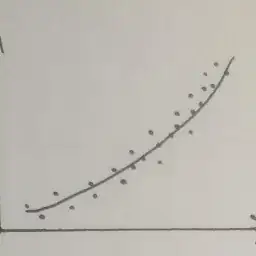
I am currently trying to classify a bunch of rivers in regard to their behavior. Many of the rivers have a behavior that is very similar to a second degree polynom.

enter image description here

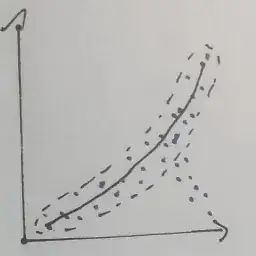
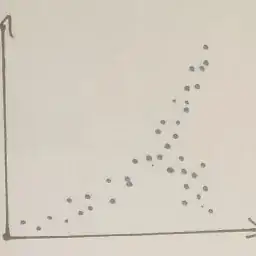
However, some of the rivers have some areas where they diverge from this pattern. enter image description hereenter image description here
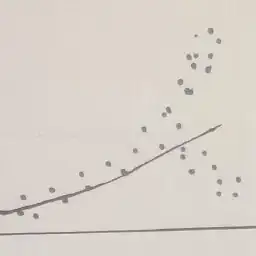
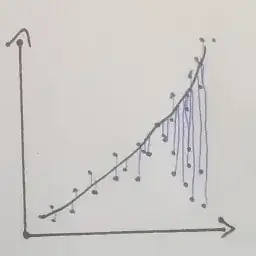
I want to classify this by calculating how far all points are away from the simple polynom. So it would basically look something like this:

enter image description here

But to be able to do this, I have to calculate the polynom for only those points that are "normal behavior". Otherwise my polynom is shifted to the direction of the diverging behavior and I cannot calculate the distances correctly.

enter image description hereenter image description here

Here is some example data.

x_test = [-150,-140,-130,-120,-110,-100,-90,-80,-70,-60,-50,-40,-30,-20,-10,0,10,20,30,40,50,60,70,70,80,80,90,90,100,100]
y_test = [0.1,0.11,0.2,0.25,0.25,0.4,0.5,0.4,0.45,0.6,0.5,0.5,0.6,0.6,0.7, 0.7,0.65,0.8,0.85,0.8,1,1,1.2,0.8,1.4,0.75,1.4,0.7,2,0.5]

I can create a polynom from it with numpy.

fit = np.polyfit(x_test, y_test, deg=2, full=True)
polynom = np.poly1d(fit[0]) 
simulated_data = polynom(x)

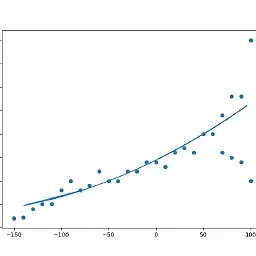
When I plot it, I get the following:

ax = plt.gca()
ax.scatter(x_test,y_test)
ax.plot(x, simulated_data)

enter image description here

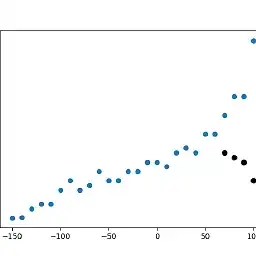
As you can see, the polynom is shifted slightly downward, which is caused by the points marked black here:

enter image description here

Is there a straightforward way to find those points that do not follow the main trend and exclude them for creating the polynom?
F. Jehn
  • 367
  • 2
  • 15
  • One thing to note is that this approach is sensitive to your choice of frame of reference. If chosen in a such a way that all the points go "up", or worse, the river banking by more than 90°, this will likely fail to result in a solution approximating the river. Unfortunately I don't know of a better approach off the top of my head, but will get back to you once I do. – Etienne Ott Aug 23 '19 at 09:12

2 Answers2

2

This looks like an AI problem more than a plain fit problem: how do you personally decide what doesn't fit - particularly in your second diverging graph, where the short first upward curve looks polynomial if you ignore the larger curve?

You only need 3 points to compute a 2-polynomial: How about computing curves for all/many samplings of 3 well-horizonally-spaced points (can't necessarily trust the first or last point) and see which creates the fewest outliers - points which are further away than 90% of the others?

You can then compute the curve based on the remaining non-outlier points, and check it fits your trivially computed curve.

Edit: 'well spaced' was intended to mean one point each from each horizontal third of the points - there's no point in using three ooints all jammed up together to try to extrapolate to the others. Also, from the looks of your supplied data, you want a curve starting around the origin and going up, so you could filter some of the randomly generated curves anyway.

Edit: The outlier suggestion was sloppy - if your data gets wider at the end, like a trumpet, you have a number of plausible fits, so it's only where it does obvious spurs that you could have a clear marker for outliers. If you compute a histogram of points vs distance from each random curve, you could scan for shoulders and asymmetries in the histogram tangents that take it away from a bell curve, and slice for outliers at that point.

Fundamentally, I think the data's potentially too complex for more than computer-aided analysis, unless you break out computer-vision techniques: get the computer to do the best it can, then visually inspect the annotated graphs to see whether you agree with it.

It might also help to plot the log of the vertical axis, so you're dealing with straight lines.

Tim Baverstock
  • 415
  • 4
  • 11
  • This might work. Could you clarify what you mean with "well-horizontally spaced points"? And I think I am confused by the outlier detection. If I check how many points are further away than 90 % of the others, shouldn't this always be 10 %? – F. Jehn Aug 23 '19 at 14:15
  • 1
    @F.Jehn My reply was too big for the comment, so I added it into the answer! – Tim Baverstock Aug 23 '19 at 15:15
  • This basically works for the example dataset I provided above. However, I realized that my example dataset does not cover all the edge cases in my data. Therefore, I am now simply using an exponential function that I fit to the data This does what I want for most of data. – F. Jehn Aug 28 '19 at 12:14
1

One approach that might work is clustering the points into "main" and "offshoot" branches, assuming there are two branches and one contains more points than the other. After that each cluster can be used to fit a polynomial that crossover at the point where the river branches merge. This can even be iterated a few more times by using the polynomials to get a better categorization into clusters by using the distance of the points to the polynomial as distance measure instead of what the clustering algorithm uses.

The common k-means algorithm is probably not a good fit as the clusters are not clustered around points but curves. Algorithms like DBSCAN might work better since they work off the density of points in the neighborhood of a given points, which is more akin to what we humans do when we see the patterns in the example datasets above.

This might look something like this (not valid code):

points = (x_test, y_test)
labels = dbscan(points, k=2, labels=("main", "offshoot"))
polynomial_main = fit_polynomial([points[x.index] for x in labels if x.label = "main"])
polynomial_off = fit_polynomial([points[x.index] for x in labels if x.label = "offshoot"])

# optionally, purely distance based clustering
# might also use different clustering algorithm using distance as measure
points_main = [p for p in points if distance(p, polynomial_main) < distance(p, polynomial_off)]
points_off = [p for p in points if distance(p, polynomial_off) < distance(p, polynomial_main)]
polynomial_main = fit_polynomial(points_main)
polynomial_off = fit_polynomial(points_off)
Etienne Ott
  • 656
  • 5
  • 14