0

I have to draw a graph: triple colors with width, prepared with four factors along the x-direction.

red = [#,#,...,#]

green = [#,#,...,#]

blue = [#,#,...,#]

width = [#,#,...,#]

red + green + blue for each x point is unity.

Found two examples in Stackoverflow and Matplolib.

curve with linewidth

multicolored curve 
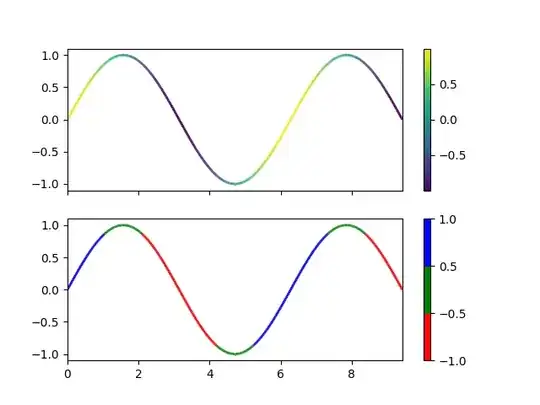
(Just above figure, but it represents only two colors. I need RGB colors)

How can these be combined as one figure maintaining the above properties?

Both are using LineCollection function.

I'm trying to write about this.

https://matplotlib.org/3.1.1/gallery/lines_bars_and_markers/multicolored_line.html

Matplotlib plot with variable line width

  • 1
    You may want to link to the sources of the images you show, such that people know what those depict. Also, you may want to provide some actual sample code - I doubt it's clear what `[#,#,...,#]` is supposed to mean. – ImportanceOfBeingErnest Aug 28 '19 at 12:16
  • Sorry for the lack of descriptions. https://stackoverflow.com/questions/19390895/matplotlib-plot-with-variable-line-width https://matplotlib.org/3.1.1/gallery/lines_bars_and_markers/multicolored_line.html And think the [#,#,...,#] is continuous but arbitrary positive values. red + green + blue is unity. For example red is created via red = e^red/sum(e^red,e^green,e^blue) –  Aug 28 '19 at 12:36
  • Ok, so maybe explain what problem you face when trying to combine the solutions? It is entirely straight forward to provide the colors instead of "blue" in the first solution. So one would need to see that code that is failing to help here. – ImportanceOfBeingErnest Aug 28 '19 at 13:04
  • I've almost done to solve this problem. After organizing, I will post. –  Aug 28 '19 at 13:09

0 Answers0