2

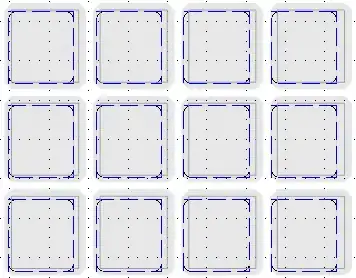
The situation is as followed: I have a rectangular grid. Which has a dot in it. Located at the top left (position: x:1 & y:1). The coordinates from this grid range from 1 to 4. Using a rotate function like described in this question. I am able to rotate this dot according the center point of a rectangular canvas. For this I use (width + 1) /2 and (height + 1)/2. The addition of the number 1 is related to the canvas, and just creates a white margin/offset/border around the rectangular grid where I plot my coordinates to. The dimensions of this canvas range from 0 to 5.

When rotating along a square grid. Everything goes well. But when the width is not equal to its height. The desired outcome is not as intended. It should rotate as a Tetris block. But the "points" of the Tetris block move outside its grid.

Below I have visualized this problem in more depth. The red dot is the point which needs to be rotated. The light blue/green point is the center point which the red dots is being rotated. The rotation is 90 degrees clockwise.

Update: Visualisation of problem What happens in a square grid enter image description here

What happens in a rectangular grid enter image description here

Code snippet

function rotate(cx, cy, x, y, angle) {
    var radians = (Math.PI / 180) * -angle,
        cos = Math.cos(radians),
        sin = Math.sin(radians),
        nx = (cos * (x - cx)) + (sin * (y - cy)) + cx,
        ny = (cos * (y - cy)) - (sin * (x - cx)) + cy;
    return {x:nx, y: ny};
}

rotate((width +1)/2, (height + 1)/2, x,y, 90)
var tempWidth = width;
width = height;
height = tempWidth;

What is the correct way to rotate a grid with its contents 90 degrees.

Update2: Visual code snippet

const svgHelper = {
    init: (width, height, scale) => {
        const svg = document.createElementNS("http://www.w3.org/2000/svg", 'svg');
        svg.setAttribute("xmlns:xlink", "http://www.w3.org/1999/xlink")
        svg.setAttribute("x", "0px")
        svg.setAttribute("y", "0px")
        svg.setAttribute("viewBox", `0 0 ${width + 1} ${height + 1}`)
        svg.setAttribute("xml:space", `preserve`)

        return svg;

    },

    addCircle: (element, color, x, y, radius, className) => {
          element.insertAdjacentHTML("beforeend", `\r<circle 
          style="fill: ${color}"
          cx="${x}"
          cy="${y}"
          r="${radius}"
          class="${className}"
          />`);
          return element.lastChild;
    },
    addText: (element, string) => {
          element.insertAdjacentHTML("beforeend", `\r<text x="0.2" y=".2">${string}</text>`);
          return element.lastChild;
    }
}

const Grid = {
    init: (width, height, margin) => {
        const result = {
            margin: margin,
            array: []
        };
        for (var i = 0; i < height; i++) {
            result.array.push([]);
            for (var ii = 0; ii < width; ii++) {
                result.array[i].push(0);
            }
        }
        return result.array;
    },
    draw: (svg) => {
        const tmp = svg.getAttribute("viewBox").split(" ");
        const width = tmp[2]
        const height = tmp[3]

        for (var y = 1; y < height; y++) {
            for (var x = 1; x < width; x++) {
                var posX = x //grid.margin
                var posY = y //grid.margin

                svgHelper.addCircle(svg, "#eee", posX, posY, .1);
            }
        }
    }
}

const updateGrid = (width, height,element) => {
    element.setAttribute("viewBox", `0 0 ${width + 1} ${height + 1}`)

    // Remove old points
    var points = element.querySelectorAll("circle")
    for (var i = 0; i < points.length; i++) {
        points[i].remove();
    }
    Grid.draw(element);
}

function rotate(cx, cy, x, y, angle) {
    var radians = (Math.PI / 180) * -angle,
        cos = Math.cos(radians),
        sin = Math.sin(radians),
        nx = (cos * (x - cx)) + (sin * (y - cy)) + cx,
        ny = (cos * (y - cy)) - (sin * (x - cx)) + cy;
    return {x:nx, y: ny};
}


const draw = (width, height) => {

    const div = document.createElement("div");
    const element = svgHelper.init(width, height);
    const span = document.createElement("span");
    div.appendChild(element);
    div.appendChild(span);
  
    span.className = "text";
    let point = {x:1, y:1};
    document.querySelector("body").appendChild(div);

    Grid.draw(element);
    let prevPoint = svgHelper.addCircle(element, "#f00", point.x, point.y, .125, "point")

    setInterval(() => {
        
        var tmpWidth = width;
        width = height;
        height = tmpWidth;
        updateGrid(width, height, element)
        
        point = rotate((width + 1)/2, (height + 1)/2, point.x, point.y, 90)
        prevPoint = svgHelper.addCircle(element, "#f00", point.x, point.y, .125, "point")
        span.innerText = `x: ${Math.round(point.x)} y: ${Math.round(point.y)}`;

    }, 1000)    
}
    
draw(4,4)
draw(1,4)
div {
    position: relative;
    display: inline-block;
}

svg {
    width: 135px;
    height: 135px;
    background-color: lightgray;
    margin: 10px;
}

span {
    font-size: 10px;
    display: block;
    margin-left: 10px;
}
<!DOCTYPE html>
<html lang="en">
<head>
    <meta charset="UTF-8">
    <title>Title</title>
  <link rel="stylesheet" href="./index.css">
</head>
<body>
<script src="index.js"></script>
</body>
</html>
user007
  • 1,557
  • 3
  • 16
  • 24
  • 3
    Yes. I am afraid your question is very hard to understand. I don't understand what the "grid" is for, and what exactly you are trying to do. What is the dot for? And what are the variables in your "What happens" sections (eg x and y)? Perhaps you could draw a picture and add it to your question? – Paul LeBeau Aug 31 '19 at 14:26
  • 3
    "*The desired outcome is not as intended*". Can you please describe what you intended and what the actual outcome is? It will help a lot if you use images to describe the problem. Also, I cannot put any meaning into the numbers you showed. Again, I believe that images would help a lot. – Nico Schertler Aug 31 '19 at 16:11
  • 1
    Not to pile on - but please share a minimum complete working test case - this should work - so maybe you're doing something odd in your SVG – Michael Mullany Aug 31 '19 at 21:14
  • 1
    Thank you guys for taking the effort of writing down what is missing. Making the image helps me personally to understand "Why does this behavior occurs". I have no understanding yet how to resolve it tho. The dot rotates in a perfect circle (which is why it works perfectly in a square). But when the square transforms into a different rectangle I need to rotate it according an ellipse. If I understand it correctly at least. – user007 Sep 01 '19 at 12:15
  • 1
    normally you'd just apply a rotate transform to rotate something. Can you provide the SVG you're trying to rotate? – Robert Longson Sep 02 '19 at 10:37
  • It seems to me that you have already solved your problem as you are calculating the white dots correctly. You just want the red dot to stay on the same white dot as it rotates, right? – ctaleck Sep 05 '19 at 04:01
  • Ah no, I now see that the grid "rotation" is simulated by swapping the width and height. Is this intentional? `var tmpWidth = width; width = height; height = tmpWidth; updateGrid(width, height, element)` – ctaleck Sep 07 '19 at 02:54

2 Answers2

5

The problem appears because your formula for point rotation doesn't take into account that the scales in X and Y directions are different. How can we fix it?

The easiest solution (IMHO) should contain three steps:

  1. Map points to the square grid
  2. Apply rotation and calculate new point coordinates
  3. Map points back to the rectangular grid

The mapping function could be easily found from the relationship

x_new = (x_old - x_center) * scale + x_center
x_old = (x_new - x_center) / scale + x_center

The relations for y coordinate whould be pretty the same, so I ommited them.

Thus your rotation function should be tweaked as follows:

function rotate(cx, cy, x, y, angle, scaleX, scaleY) { // <= Adding scale factors here
  // Mapping initial points to a square grid
  x = (x - cx) / scaleX + cx;
  y = (y - cy) / scaleY + cy;

  // Applying rotation
  var radians = (Math.PI / 180) * -angle,
    cos = Math.cos(radians),
    sin = Math.sin(radians),
    nx = (cos * (x - cx)) + (sin * (y - cy)) + cx,
    ny = (cos * (y - cy)) - (sin * (x - cx)) + cy;

  // Mapping new point coordinates back to rectangular grid
  nx = (nx - cx) * scaleX + cx;
  ny = (ny - cy) * scaleY + cy;

  return {x: nx, y: ny};
}

Here is an animation, how it works now: enter image description here

And here is a working example:

function clearAll(container) {
  const ctx = container.getContext('2d');
  ctx.clearRect(0, 0, 300, 300);
}

function putPoint(container, x, y, r, color) {
  const ctx = container.getContext('2d');
  ctx.beginPath();
  ctx.fillStyle = color;
  ctx.arc(x, y, r, 0, 2 * Math.PI);
  ctx.fill();
}

function drawGrid(container, scaleX, scaleY, elapsedTime) {
  const scale = 60;
  const offset = 60;

  const centerX = offset + 1.5 * scale * scaleX;
  const centerY = offset + 1.5 * scale * scaleY;

  clearAll(container);
  putPoint(container, centerX, centerY, 3, 'cyan');

  for (let i = 0; i < 4; i++) {
    for (let j = 0; j < 4; j++) {
      const x = offset + scaleX * scale * i;
      const y = offset + scaleY * scale * j;
      putPoint(container, x, y, 2, 'black');
    }
  }

  putPoint(container, offset, offset, 5, 'red');
  const newPosition1 = rotate(centerX, centerY, offset, offset, 90, scaleX, scaleY);
  putPoint(container, newPosition1.x, newPosition1.y, 5, 'red');

  const newPosition2 = rotate(centerX, centerY, offset, offset, 180, scaleX, scaleY);
  putPoint(container, newPosition2.x, newPosition2.y, 5, 'red');

  const newPosition3 = rotate(centerX, centerY, offset, offset, 270, scaleX, scaleY);
  putPoint(container, newPosition3.x, newPosition3.y, 5, 'red');

  const newPosition4 = rotate(centerX, centerY, offset, offset, 45, scaleX, scaleY);
  putPoint(container, newPosition4.x, newPosition4.y, 5, 'red');

  const newPositionDynamic = rotate(centerX, centerY, offset, offset, elapsedTime, scaleX, scaleY);
  putPoint(container, newPositionDynamic.x, newPositionDynamic.y, 5, 'red');


  requestAnimationFrame(() => {
    drawGrid(container, scaleX, scaleY, elapsedTime + 1);
  })
}

function rotate(cx, cy, x, y, angle, scaleX, scaleY) { // <= Adding scale factors here
  // Mapping initial points to a square grid
  x = (x - cx) / scaleX + cx;
  y = (y - cy) / scaleY + cy;

  // Applying rotation
  var radians = (Math.PI / 180) * -angle,
cos = Math.cos(radians),
sin = Math.sin(radians),
nx = (cos * (x - cx)) + (sin * (y - cy)) + cx,
ny = (cos * (y - cy)) - (sin * (x - cx)) + cy;

  // Mapping new point coordinates back to rectangular grid
  nx = (nx - cx) * scaleX + cx;
  ny = (ny - cy) * scaleY + cy;

  return {x: nx, y: ny};
}

const squareGrid = document.getElementById('square-grid');
const rectangularGrid = document.getElementById('rectangular-grid');

drawGrid(squareGrid, 1, 1, 0);
drawGrid(rectangularGrid, 0.5, 0.9, 0);
canvas {
  width: 300px;
  height: 300px;
  background-color: lightgray;
  margin: 10px;
}
<!DOCTYPE html>
<html lang="en">
<head>
    <meta charset="UTF-8">
    <title>Title</title>
  <link rel="stylesheet" href="./index.css">
</head>
<body>
<canvas width="300" height="300" id="square-grid"></canvas>
<canvas width="300" height="300" id="rectangular-grid"></canvas>

<script src="index.js"></script>
</body>
</html>

Please, let me know if I understood you wrong or this solution is not the one you expected to get

Sergey Mell
  • 7,780
  • 1
  • 26
  • 50
  • I do not understand how you have defined your scaling. Plus the proposed solution uses the same grid in both scenario's, but just with a different aspect ratio. It was helpful tho. Since I've learned how to add a code snippet and updated the original question with a code snippet. Visualizing the problem. – user007 Sep 04 '19 at 19:33
  • I see your problem now. Let me examine it a bit more carefully and I think I'll come up with a solution – Sergey Mell Sep 05 '19 at 22:43
2

Simulated rotation

Since I noticed your grid rotation is "simulated" (as shown by the darker shaded dots) I decided to provide an answer that "simulates" the rotation of the red dot as that may meet your needs also. I believe the effect is the same.

const svgHelper = {
  init: (width, height, scale) => {
    const svg = document.createElementNS("http://www.w3.org/2000/svg", 'svg');
    svg.setAttribute("xmlns:xlink", "http://www.w3.org/1999/xlink")
    svg.setAttribute("x", "0px")
    svg.setAttribute("y", "0px")
    svg.setAttribute("viewBox", `0 0 ${width + 1} ${height + 1}`)
    svg.setAttribute("xml:space", `preserve`)
    return svg;
  },

  addCircle: (element, color, x, y, radius, className) => {
    element.insertAdjacentHTML("beforeend", `\r<circle 
          style="fill: ${color}"
          cx="${x}"
          cy="${y}"
          r="${radius}"
          class="${className}"
          />`);
    return element.lastChild;
  },
  addText: (element, string) => {
    element.insertAdjacentHTML("beforeend", `\r<text x="0.2" y=".2">${string}</text>`);
    return element.lastChild;
  }
}

const Grid = {
  init: (width, height, margin) => {
    const result = {
      margin: margin,
      array: []
    };
    for (var i = 0; i < height; i++) {
      result.array.push([]);
      for (var ii = 0; ii < width; ii++) {
        result.array[i].push(0);
      }
    }
    return result.array;
  },
  draw: (svg) => {
    const tmp = svg.getAttribute("viewBox").split(" ");
    const width = tmp[2]
    const height = tmp[3]
    for (var y = 1; y < height; y++) {
      for (var x = 1; x < width; x++) {
        var posX = x //grid.margin
        var posY = y //grid.margin
        var color = (x === width - 1) ? "#999" : "#eee";
        svgHelper.addCircle(svg, color, posX, posY, .1);
      }
    }
  }
}

const updateGrid = (width, height, element) => {
  element.setAttribute("viewBox", `0 0 ${width + 1} ${height + 1}`)
  // Remove old points
  var points = element.querySelectorAll("circle")
  for (var i = 0; i < points.length; i++) {
    points[i].remove();
  }
  Grid.draw(element);
}

function simulatedRotation(width, height, rotation) {
  switch (rotation) {
    case 1:
      return {
        x: 1,
        y: 1
      };
      break;
    case 2:
      return {
        x: width,
        y: 1
      };
      break;
    case 3:
      return {
        x: width,
        y: height
      };
      break;
    case 4:
      return {
        x: 1,
        y: height
      };
      break;
  }
}

const draw = (width, height) => {
  const element = svgHelper.init(width, height);
  const span = document.createElement("span");
  span.className = "text";
  let point = {
    x: 1,
    y: 1
  };
  const div = document.createElement("div");
  div.appendChild(element);
  div.appendChild(span);
  document.querySelector("body").appendChild(div);
  Grid.draw(element);
  let prevPoint = svgHelper.addCircle(element, "#f00", point.x, point.y, .125, "point")
  let rotation = 1;
  setInterval(() => {
    // grid is just swapping axis to simulate rotation
    var tmpWidth = width;
    width = height;
    height = tmpWidth;
    rotation++;
    if (rotation > 4) rotation = 1;
    updateGrid(width, height, element);
    point = simulatedRotation(width, height, rotation);
    prevPoint = svgHelper.addCircle(element, "#f00", point.x, point.y, .125, "point");
    span.innerText = `x: ${Math.round(point.x)} y: ${Math.round(point.y)} r: ${rotation}`;
  }, 1000)
}

draw(4, 4);
draw(3, 4);
draw(2, 4);
draw(1, 4);
div {
  position: relative;
  display: inline-block;
}

svg {
  width: 135px;
  height: 135px;
  background-color: lightgray;
  margin: 10px;
}

span {
  font-size: 10px;
  display: block;
  margin-left: 10px;
}
ctaleck
  • 1,658
  • 11
  • 20
  • I am trying to decypher what you have done and how this solution can be implemented scaleable. So with 2 dots in it, or with the dot located on a different starting position. Rather than 1,1. – user007 Sep 09 '19 at 17:33
  • Probably should have put a caveat on this solution as not being scaleable. A better solution would be to just simply rotate the whole SVG with a `transform`. https://css-tricks.com/transforms-on-svg-elements/ – ctaleck Sep 09 '19 at 18:43