0

I am pretty new to R programming. Can someone please help me here?

This question has already been answered here but rbindlist is having certain limitations hence want some different approach: For each item in Dataframe want to loop automatically

I want to create a network graph between the warehouses:

Here in the input data, each item can be shipped from LC to an ToLC and these LCs are interlinked also. For each item with the different combination of connection between the warehouses we need the output.

input data:

    library(data.table)
lctolc <- fread("
Item     LC     ToLC
8T4121  AB12    BC34
8T4121  MN12    AB12
8T4121  MW92    WK14
8T4121  WK14    RM11
8T4121  WK14    RS11
8T4121  RS11    OY01
AB7651  MW92    RS11
AB7651  RS11    OY01",
data.table = FALSE)

Here, in the input table we can see:

For Item 8T4121 we have warehouse connection as AB12->BC34 and in next line we have warehouse connection as MN12->AB12

So this should be warehouse MN12->AB12->BC34

Similarly, we have MW92->WK14 and WK14->RM11 and WK14->RS11 and RS11->OY01
So this should make two lanes MW92->WK14->RM11 and MW92->WK14->RS11->OY01

Output should be like below:

     Item  LC1  LC2  LC3  LC4
1: 8T4121 MN12 AB12 BC34 <NA>
2: 8T4121 MW92 WK14 RS11 OY01
3: 8T4121 MW92 WK14 RM11 <NA>
4: AB7651 MW92 RS11 OY01 <NA>

Till now what I have tried:

library(data.table)

bodlane <- lapply(
  lapply(split(lctolc, lctolc$Item), function(x) graph.data.frame(x[, 2:3])), 
  function(x) lapply(
    V(x)[degree(x, mode = "in") == 0], 
    function(s) all_simple_paths(x, from = s, 
                                 to = V(x)[degree(x, mode = "out") == 0]) %>% 
      lapply(
        function(y) as.data.table(t(names(y))) %>% setnames(paste0("LC", seq_along(.)))
      ) %>% 
      rbindlist(fill = TRUE) 
  ) %>% rbindlist(fill = TRUE)
) %>% rbindlist(fill = TRUE, idcol = "Item")

When I am running this code for large dataset I am getting the below mentioned error:

Error in rbindlist(., fill = TRUE, idcol = "Item"): attempt to set index 50611/50611 in SET_STRING_ELT
Anshul S
  • 281
  • 1
  • 5
  • I struggle to understand the logic behind your expected output. What determines whether an entry is placed in `LC1`, `LC2`, `LC3` or `LC4`? Why are some entries repeated? Can you walk us through e.g. the first row of `lctolc` and explain what happens to these entries to produce the relevant rows in your expected output. – Maurits Evers Sep 02 '19 at 08:30

2 Answers2

1

I'm not sure I understand (the logic behind) your expected output, nor why you need this particular output for generating a network graph.

You could create a network graph directly from lctolc in the following way

library(igraph)
ig <- graph_from_data_frame(lctolc[, 2:3])
plot(ig)

enter image description here


Update

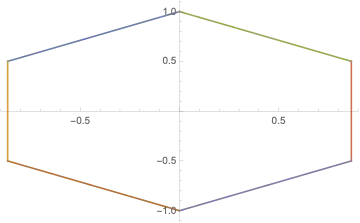
In response to the example from your comment, consider the following graph

df <- read.table(text = 
    "A  B
     B  C
     B  D", header = F)

library(igraph)
ig <- graph_from_data_frame(df)
plot(ig)

enter image description here

As you can see, the graph correctly shows the connection A->B->C and A->B->D.

Maurits Evers
  • 49,617
  • 4
  • 47
  • 68
  • Here, in the input table we can see: For Item 8T4121 we have warehouse connection as AB12->BC34 and in next line we have warehouse connection as MN12->AB12 So this should be warehouse MN12->AB12->BC34 Similarly, we have MW92->WK14 and WK14->RM11 and WK14->RS11 and RS11->OY01 So this should make two lanes MW92->WK14->RM11 and MW92->WK14->RS11->OY01 – Anshul S Sep 02 '19 at 08:41
  • I want different warehouse combination for all the LCs for each Item – Anshul S Sep 02 '19 at 08:43
  • *"So this should be warehouse MN12->AB12->BC34 "* That's exactly what the graph shows in the cluster on the right. Try to describe the problem in a domain-agnostic way. `lctolc` has two columns which correspond to network `to` and `from` nodes. I don't understand what you mean by "different warehouse combination for all the LCs for each Item". – Maurits Evers Sep 02 '19 at 09:11
  • Yes, lctolc has 2 columns LC(From) and ToLC(To). Yes, MN12->AB12->BC34 is perfectly fine. Now, I want two things each graph should with respect to the Item number. In your graph you have connected MW92->RS11 which is for Item AB7651 and not 8T4121. Second thing, if for Item 8T4121 what could be the different warehouse connection from the starting node like: 2: 8T4121 MW92 WK14 RS11 OY01 3: 8T4121 MW92 WK14 RM11 – Anshul S Sep 02 '19 at 09:15
  • With the code that I pasted, I am getting the desired output but When I am running this code for large dataset I am getting the below mentioned error in the last line: Error in rbindlist(., fill = TRUE, idcol = "Item"): attempt to set index 50611/50611 in SET_STRING_ELT If you can help me with this with some other alternative – Anshul S Sep 02 '19 at 09:17
  • I don't understand much of what you've just said in the last two comments. For example, I don't understand what *"Now, I want two things each graph should with respect to the Item number."* means. Unless you can expand on the problem statement in a clear way, or provide your expected graph output for the sample data you give, I'm afraid I won't be able to help. – Maurits Evers Sep 02 '19 at 09:19
  • See it is quite simple. If A is connected to B and B is connected to C and D both. So, I need the output in a dataframe with two rows A->B->C and A->B->D as both are two different routes I hope this clarifies your doubts – Anshul S Sep 02 '19 at 09:22
  • Wrt "Now, I want two things each graph should with respect to the Item number." It means that the data table has multiple Items with From and To nodes. So, for each item what could be the different possible routes – Anshul S Sep 02 '19 at 09:25
  • *"See it is quite simple. If A is connected to B and B is connected to C and D both. So, I need the output in a dataframe with two rows A->B->C and A->B->D as both are two different routes I hope this clarifies your doubts "* Nope sorry, not clear. See my edit. I might be wrong, but perhaps this is more of an issue with understanding a graph in general? – Maurits Evers Sep 02 '19 at 09:49
  • Let us [continue this discussion in chat](https://chat.stackoverflow.com/rooms/198815/discussion-between-anshul-s-and-maurits-evers). – Anshul S Sep 02 '19 at 10:01
  • yes, graph is showing correct A->B->C and A->B->D Can I have these two routes 1. A->B->C and 2. A->B->D be stored in a dataframe – Anshul S Sep 02 '19 at 10:02
  • @AnshulS You can use `igraph::all_simple_paths` to get a list of all paths from a source node. For example, `all_simple_paths(ig, "A")` lists all paths starting from node `"A"`. – Maurits Evers Sep 02 '19 at 11:35
  • You can see my code I have used all_simple_paths, only thing is I am getting error with rbindlist in last line. Any other alternative for that – Anshul S Sep 02 '19 at 11:39
  • It's hard to help with problems of the form "it's working for the data I posted but throws an error for the actual larger dataset I'm using". The reason being: We don't know anything about the bigger dataset. All we can infer is that the smaller sample data you give is *not* representative of your actual data. So it is up to you to take a step back and revise/edit your post to reflect your actual problem. So please take some time to provide some *representative* & *minimal* data and edit your post accordingly. If it takes a day or two, that's absolutely fine. – Maurits Evers Sep 02 '19 at 11:53
1

I couldn't quite follow the disucssion in the comments of Maurits Evers answer. But from what I understand you want to separate out individual networks for each item id? This can be achieved by split on lctolc$Item and igraph::decompose():

library(dplyr)
library(igraph)
library(GGally)

g <- split(lctolc, lctolc$Item) %>%
  lapply(function(x) decompose(graph_from_data_frame(x[, c("LC", "ToLC")]))) %>%
  unlist(recursive = FALSE) %>%
  lapply(simplify)

# network diagrams
lapply(g, ggnet2, label = TRUE, arrow.size = 12, arrow.gap = 0.025)

Desired output

With help from https://stackoverflow.com/a/47641823/8675075

tmp <- lapply(g, function(x) {

  # Get all edges
  e <- get.edgelist(x)

  # Root vertices are in first column but not in second column
  root <- setdiff(e[, 1], e[, 2])

  # Terminal vertices are in second column but not in first column
  terminal <- setdiff(e[, 2], e[, 1])

  all_simple_paths(x, root, to = terminal)

}) %>%
  unlist(recursive = FALSE) %>%
  lapply(names)


sapply(tmp, function(x, n) {
  length(x) <- n
  x
}, n = max(sapply(tmp, length))) %>%
  t() %>%
  as_tibble(rownames = "Item", .name_repair = "unique") %>%
  setNames(c("Item", paste0("LC", 1:(ncol(.)-1))))

# A tibble: 4 x 5
  Item     LC1   LC2   LC3   LC4  
  <chr>    <chr> <chr> <chr> <chr>
1 8T41211  MN12  AB12  BC34  NA   
2 8T412121 MW92  WK14  RS11  OY01 
3 8T412122 MW92  WK14  RM11  NA   
4 AB7651   MW92  RS11  OY01  NA 

Your item names have a bit of extra information (probably from the unlist() commands), but I'm sure you could build some filters to handle it.

Paul
  • 2,877
  • 1
  • 12
  • 28