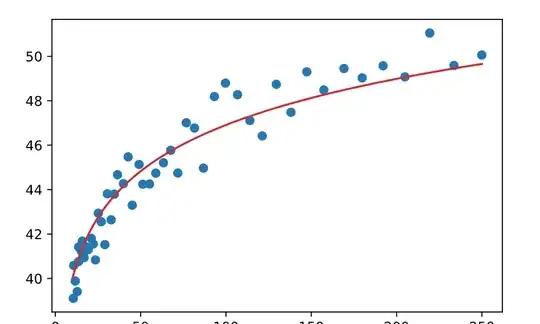
I have a set of 50 data points that look like this:

and want to fit a curve like this:
 If I fit log(x) I get a nice linear relation (kind of) like this:
 But I really want it to be the second curve which means that I somehow have to change it back, but saving the fitted curve.
Probably very easy but I am lost.
Edit:
This is the polyfit x,y, deg=3 curve that seems overfitted.

