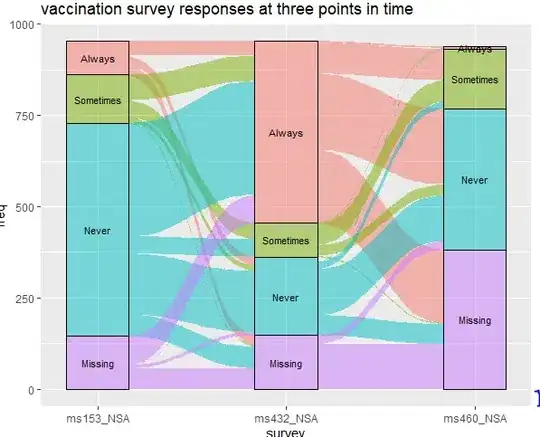
I was wondering how we could align the x-axis with the zero on the y-axis. I tried adjusting the limits, with ylim(0, 1000), however that does not seem to work.
library(ggalluvial)
data(vaccinations)

vaccinations <- vaccinations[-c(94),]
levels(vaccinations$response) <- rev(levels(vaccinations$response))
ggplot(vaccinations,
       aes(x = survey, stratum = response, alluvium = subject,
           y = freq,
           fill = response, label = response)) +
  scale_x_discrete(expand = c(.1, .1)) +
  geom_flow() +
  geom_stratum(alpha = .5) +
  geom_text(stat = "stratum", size = 3) +
  theme(legend.position = "none") +
  ggtitle("vaccination survey responses at three points in time")
See the plot here, with a blue marker, marking the space that I would like to remove.

