0

I'm using lapply and update to create a series of colors to include in a series of ggplot pop-ups. The plots are to appear in a leaflet map, as demonstrated here. What is the "need an object with call component" error all about, and how do I resolve it?

x<-structure(list(FacilName = c("ALL ABOU", "ANITA BR", "RAINBOW ", "RANEY DA", "CAS DONO", "A HOME A", "COURT TI", "ECONOMY "), 
              lon = c(-79.8466921, -79.9265183, -80.240089, -79.7807676, -79.8687159, -79.8064845, -79.8527703, -80.2034522), 
              lat = c(40.5808574, 40.2919276, 40.6674307, 40.5880096, 40.1815023, 40.3850284, 40.2577138, 40.6867816), 
              HC01_VC04 = c(4370L, 7700L, 1056L, 584L, 2318L, 1029L, 5053L, 4202L), 
              HC01_VC87 = c(0L, 0L, 0L, 0L, 31L, 0L, 6L, 22L), 
              IDnum = c("11", "12", "13", "14", "15", "16", "17", "18")), row.names = 11:18, class = "data.frame")


p<-ggplot(x, aes(HC01_VC87,HC01_VC04))+geom_point() # construct a basic plot
p<-mget(rep("p",length(x$FacilName)))  # create a set of plots to pop-up in map with `mget`

clr <- rep("orange", length(x$FacilName))    # default color in scatterplot

# create points that indicates specific facility when popup opens
# error occurs here
p <- lapply(1:length(p), function(i) {
clr[i] <- "dark green"
update(p[[i]], col = clr)  })

# map this (will throw error because previous command throws error)
library(leaflet);library(mapview)
leaflet() %>% addTiles()%>%
addCircleMarkers(data=x,label=x$FacilName,
               weight = .4,fillOpacity = 1,radius = 4,
               popup = popupGraph(p)) 
Ben
  • 1,113
  • 10
  • 26

2 Answers2

2

I ran the sessionInfo() for mine and it is the following:

enter image description here

So, it looks like we do have some version differences which may be part of the problem. I just installed R last week on a new computer.

Also, it does not look like it likes a ggplot object.

Below is my full working code. I commented out your ggplot and added the library regal.

library(ggplot2)
library(leaflet)
library(lattice)
library(mapview)
library(sp)
library(rgdal)

x<-structure(list(FacilName = c("ALL ABOU", "ANITA BR", "RAINBOW ", "RANEY DA", "CAS DONO", "A HOME A", "COURT TI", "ECONOMY "), 
                  lon = c(-79.8466921, -79.9265183, -80.240089, -79.7807676, -79.8687159, -79.8064845, -79.8527703, -80.2034522), 
                  lat = c(40.5808574, 40.2919276, 40.6674307, 40.5880096, 40.1815023, 40.3850284, 40.2577138, 40.6867816), 
                  HC01_VC04 = c(4370L, 7700L, 1056L, 584L, 2318L, 1029L, 5053L, 4202L), 
                  HC01_VC87 = c(0L, 0L, 0L, 0L, 31L, 0L, 6L, 22L), 
                  IDnum = c("11", "12", "13", "14", "15", "16", "17", "18")), row.names = 11:18, class = "data.frame")

# commented out ggplot do not run the plot below
# p<-ggplot(x, aes(HC01_VC87,HC01_VC04))+geom_point() # construct a basic plot

# note using lattice and making xyplot
p <- xyplot(HC01_VC04 ~ HC01_VC87, data = x, col = "orange", pch = 20, cex = 2)

p<-mget(rep("p",length(x)))  # create a set of plots to pop-up in map with `mget`

clr <- rep("orange", length(x))    # default color in scatterplot

# create points that indicates specific facility when popup opens
# error occurs here
p <- lapply(1:length(p), function(i) {
    clr[i] <- "dark green"
    update(p[[i]], col = clr)  })

# map this (will throw error because previous command throws error)
m <- leaflet() %>% 
    addTiles()%>%
    addCircleMarkers(data=x,label=x$FacilName,
                     weight = .4,fillOpacity = 1,radius = 4,
                     popup = popupGraph(p)) 
m

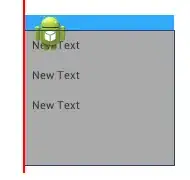
I get the output below with colors.

enter image description here

Bryan Butler
  • 1,750
  • 1
  • 19
  • 19
  • The issue seems to be with `ggplot`. When I run your code with `xyplot` all is good; with `ggplot` I throw the "need an object with call component" error. Thanks! – Ben Sep 19 '19 at 16:51
  • Great - yes, my original was an xyplot. I think that the list format of ggplot cannot be appended too easily. – Bryan Butler Sep 19 '19 at 21:22
0

You need to make sure that the following packages are installed:

library(ggplot2)
library(leaflet)
library(lattice)
library(mapview)
library(sp)

I ran all of your code after installing the libraries and it works.

Mapview requires the 'sf' package which can be difficult to install depending on your system.

enter image description here

Bryan Butler
  • 1,750
  • 1
  • 19
  • 19
  • Bryan, the `sf` package loads with no issue, but I'm still throwing an error. My R ver 3.5.1 session info shows: attached base packages: [1] stats graphics grDevices utils datasets methods base other attached packages: [1] leaflet_2.0.2 forcats_0.4.0 stringr_1.4.0 dplyr_0.8.0.1 purrr_0.3.2 readr_1.3.1 tidyr_0.8.3 [8] tibble_2.1.1 ggplot2_3.1.1 tidyverse_1.2.1 expss_0.8.10 RODBC_1.3-15 sf_0.7-3 lattice_0.20-38 [15] mapview_2.6.3 sp_1.3-1 – Ben Sep 18 '19 at 13:45