I want to plot data in matplotlib in real time. I want to open a figure once at the start of the programme, then update the figure when new data is acquired. Despite there being a few similar questions out there, none quite answer my specific question.
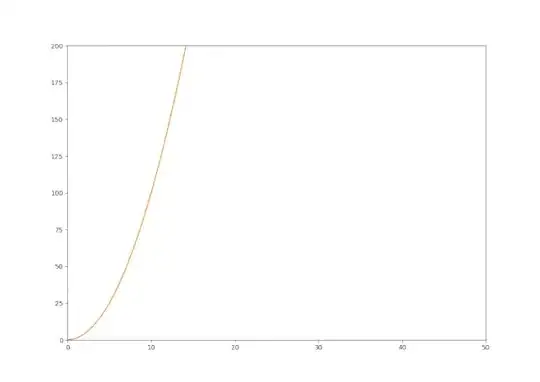
I want each set of data points new_data1 and new_data2 to be plotted on the same figure at the end of each while loop i.e. one line after the first while loop, two lines on the same figure after the second while loop etc. Currently they are all plotted together, but only right at the end of the programme, which is no use for real time data acquisition.
import matplotlib.pyplot as plt
import numpy


hl, = plt.plot([], [])

def update_line(hl, new_datax, new_datay):
    hl.set_xdata(numpy.append(hl.get_xdata(), new_datax))
    hl.set_ydata(numpy.append(hl.get_ydata(), new_datay))
    plt.xlim(0, 50)
    plt.ylim(0,200)
    plt.draw()

x = 1
while x < 5:
    new_data1 = []
    new_data2 = []
    for i in range(500):
        new_data1.append(i * x)
        new_data2.append(i ** 2 * x)
    update_line(hl, new_data1, new_data2)
    x += 1

else:
    print("DONE")
This programme plots all 5 lines, but at the end of the programme. I want each line to be plotted after one another, after the while loop is completed. I have tried putting in plt.pause(0.001) in the function, but it has not worked.
This programme is different from the one that has been put forward - that programme only plots one graph and does not update with time.

