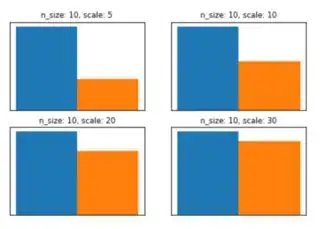
In Python I was making a graph of multiple sub-barplots, and eventually decided, for aesthetic purposes, to try and remove the horizontal whitespace between them, but this seemingly easy task is not working out somehow.
My current graph looks like this,
And the code to generate it is this,
## The data first, pardon its length
data = {'n_size: 10, scale: 5': {'Normal_data': {'T_model': {'% model_mean_accuracy': 0.9665604111322623,
    '% model_std_accuracy': 0.1403044027874627},
   'Normal_model': {'% model_mean_accuracy': 0.3588016310928018,
    '% model_std_accuracy': 0.15670772400999605}},
  'T_data': {'T_model': {'% model_mean_accuracy': 0.9571050544498441,
    '% model_std_accuracy': 0.4919716194794976},
   'Normal_model': {'% model_mean_accuracy': 0.33135961083598975,
    '% model_std_accuracy': 0.09517290555081247}}},
 'n_size: 10, scale: 10': {'Normal_data': {'T_model': {'% model_mean_accuracy': 0.9641872823759053,
    '% model_std_accuracy': 0.12880945204032987},
   'Normal_model': {'% model_mean_accuracy': 0.5566844810693337,
    '% model_std_accuracy': 0.16096047896246227}},
  'T_data': {'T_model': {'% model_mean_accuracy': 0.6216338568355548,
    '% model_std_accuracy': 0.7082362141795221},
   'Normal_model': {'% model_mean_accuracy': 0.3948692029244512,
    '% model_std_accuracy': 0.18799991442400232}}},
 'n_size: 10, scale: 20': {'Normal_data': {'T_model': {'% model_mean_accuracy': 0.9680652106664631,
    '% model_std_accuracy': 0.11374246421698583},
   'Normal_model': {'% model_mean_accuracy': 0.7466108597314576,
    '% model_std_accuracy': 0.15341975348920403}},
  'T_data': {'T_model': {'% model_mean_accuracy': 1.1329410521346626,
    '% model_std_accuracy': 0.09506974062859724},
   'Normal_model': {'% model_mean_accuracy': 0.6864829731707396,
    '% model_std_accuracy': 0.13872252491967219}}},
 'n_size: 10, scale: 30': {'Normal_data': {'T_model': {'% model_mean_accuracy': 0.933652508907905,
    '% model_std_accuracy': 0.03935646501763717},
   'Normal_model': {'% model_mean_accuracy': 0.8218968469603595,
    '% model_std_accuracy': 0.13640544525624385}},
  'T_data': {'T_model': {'% model_mean_accuracy': 0.9965691581931089,
    '% model_std_accuracy': 0.05996151343132031},
   'Normal_model': {'% model_mean_accuracy': 0.8539754983373469,
    '% model_std_accuracy': 0.012542281271065603}}}}


def draw_barplots(data, rows_columns_length = 5):

    fig=plt.figure()

#     plt.subplots_adjust(wspace=0.0)
#     fig.subplots_adjust(wspace=0.0)

    ## Calculating the correct # of rows/columns for whole figure
    n_cols = rows_columns_length
    n_rows = len(data) / rows_columns_length
    if not (n_rows).is_integer():
        n_rows = n_rows + 1

#     matplotlib.gridspec.GridSpec(n_rows, n_cols, wspace=0.0)

    for i, var_name in enumerate(data):
        ax = fig.add_subplot(n_rows, n_cols, i+1)

        width = 0.5
        ax.bar(x = [0], height = [data[var_name]['Normal_data']['T_model']['% model_mean_accuracy']],
               width=width, label = 'T_model'
              )
        ax.bar(x = [0.5], height = [data[var_name]['Normal_data']['Normal_model']['% model_mean_accuracy']],
              width=width, label='Normal_model'
              )

        ax.set_title(var_name, size=8.5)
        ax.xaxis.set_visible(False)
        ax.yaxis.set_visible(False)

#     plt.subplots_adjust(wspace=0.0)
#     fig.subplots_adjust(wspace=0.0)
#     matplotlib.gridspec.GridSpec(n_rows, n_cols, wspace=0.0)

    plt.show()

draw_barplots(data, 2)
I have tried setting plt.subplots_adjust(hspace=0.0) and matplotlib.gridspec.GridSpec(n_rows, n_cols, hspace=0.0), as per these answers (link1, link2), but they seem not to work.
How can I understand what is going on?
