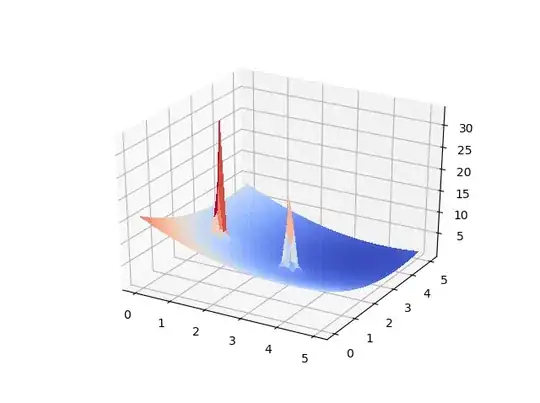
I'm working on a path planning problem in a configuration space with obstacles. I modelized it with a potential field where obstacles are the emerging peaks from the surface. I'd like to interpolate these peaks in order to have a smoother representation of the obstacles. I tried to work with scipy griddata function but it gave me this: (see second image). Does anyone have an idea please?


Here's my code:
#map
nx = 40
ny = 40
x = np.linspace(0,5,nx)
y = np.linspace(0,5,ny)
X,Y = np.meshgrid(x,y)

#data to plot
U = np.zeros((nx,ny))
points = []
for i in range(nx):
    for j in range(ny):
        U[i][j] = potential(X[i][j],Y[i][j],gx,gy,obstacle,mu)
        points.append([i,j])

#interpolation
xnew ,ynew = np.linspace(0,5,2*nx), np.linspace(0,5,2*ny)
Xnew, Ynew = np.meshgrid(xnew,ynew)
values = np.reshape(U,(1600,))
Z = griddata(points, values, (Xnew, Ynew), method='linear')

#plot
fig = plt.figure()
ax = fig.gca(projection='3d')
surf = ax.plot_surface(Xnew, Ynew, Z, cmap=cm.coolwarm,linewidth=0, antialiased=False)
fig2 = plt.figure()
ax = fig2.gca(projection='3d')
surf = ax.plot_surface(X, Y, U, cmap=cm.coolwarm,linewidth=0, antialiased=False)
fig.colorbar(surf, shrink=0.5, aspect=5)

plt.show()