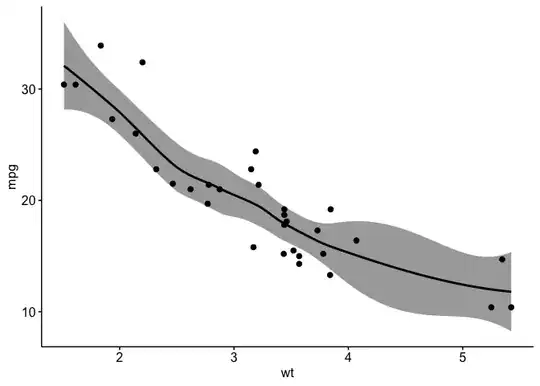
I am trying to replicate this plot in R.
I have some difficulties : I don't know the code to create the line 90 min (it is not a continuous line, it starts at 2000)
How can I add the text R1, R2 and R3 in my plot?
How can I add the title for each line in my plot?
This is my current code :
plot(Year,Duration, abline(v=2000, col="green"))
Thanks

