this is for homework.
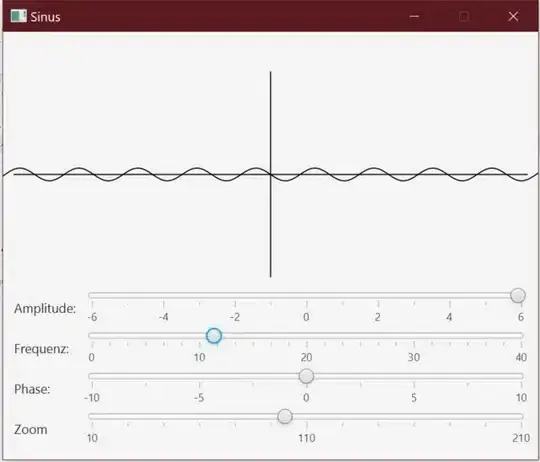
We have to create a JavaFX application, complying to the MVP principle, that shows a static sine-wave, with sliders to control the properties of said sine-wave.
These sliders are the amplitude, frequency, phase, and zoom. They're bound, through the presenter, to properties in my model that make up the sine-wave. These then have listeners to update the model on changes.
For drawing my sine-wave, I chose a polyline and I calculate the X and Y coordinates for each point to a observable list in my model:
for (double x = -360; x < 360; x++) {
    data.add(x);
    data.add(Math.sin(frequency.doubleValue() * x + phase.doubleValue()) * amplitude.doubleValue());
}
Then I reach this dataset to my view through the presenter where I give each point to my polyline:
public void setPoints(ObservableList<Double> list) {
        functionLine.getPoints().clear();
        functionLine.getPoints().addAll(list);
        double temp;
        for(int i = 0;i<functionLine.getPoints().size();i++) {
            //separate x from y coordinates
            if (i % 2 == 0) {
                temp = functionLine.getPoints().get(i);
                functionLine.getPoints().set(i, temp + (display.getWidth() / 2)); // + displaywidth/2 to get it to the center of the graph
            } else {
                temp = functionLine.getPoints().get(i);
                functionLine.getPoints().set(i, temp + ((display.getHeight() / 2))); //same as above
            }
        }
    }
This also doesn't perform very well because of the for-loop and the interface is laggy, but that's not why I am here. This is what is currently looks like. The polyline and graph (two lines) are located in its own pane:
Now I have tried to also add zoom to this without increasing the width of the actual line, but I can't figure out how to properly scale around the center of my graph. Obviously I have to transform the coordinates of each point, but I don't know how. I have tried several things but it doesn't achieve what I want.
Feels like something I should be able to do on my own, but I can't apparently.
Any help would be appreciated.
