I need to make a map where the interpolated data is on it. My code for plotting is:
library(ggplot2)
theme_set(theme_bw())
library(sf)
library(rnaturalearth)
library(rnaturalearthdata)
library(ggthemes)
world <- ne_countries(scale = "medium", returnclass = "sf")
class(world)
ggplot(data = world)+
  geom_tile(data = d, aes(x = lon, y = lat, fill=x))+
  geom_raster(data = d, aes(x = lon, y = lat, fill=x))+
  geom_sf()+
  coord_sf(xlim=c(3,35), ylim=c(52,72))
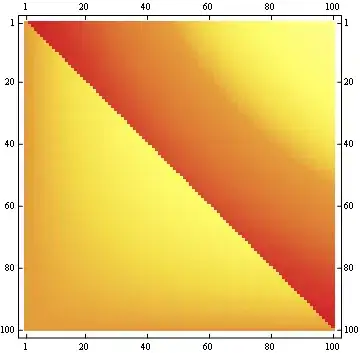
I have received a plot like this
But I need only the countries contour to be on the plot with no difference either it is land or sea. Could ypu please help me in terms of this boarders.


