2

I have an issue with boxplot graphs using ggplot or boxplot function in R. I went through some of the questions here but none of them solve my issue.

I have data set contains 20 samples and ten elements for each. I'm trying to produce box plot so this is what I did so far:

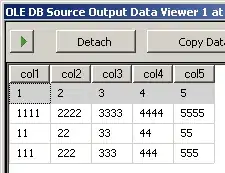
  1. I have used the melt function to transform the data set into a long format (See picture, is just an example of one element)
NC_RSD.ca.m <- melt(NC_RSD.ca, id.var="Sample")

Here is the example data:

structure(list(Sample = structure(c(15L, 16L, 17L, 18L, 19L, 
20L, 1L, 2L, 3L, 4L, 5L, 6L, 7L, 8L, 9L, 10L, 11L, 12L, 13L, 
14L), .Label = c("NC10", "NC11", "NC12", "NC13", "NC14", "NC15", 
"NC16", "NC17", "NC18", "NC19", "NC20", "NC21", "NC22", "NC23", 
"NC4", "NC5", "NC6", "NC7", "NC8", "NC9"), class = "factor"), 
    Al = c(21.54055979, 13.89504614, 20.19173286, 15.39846212, 
    18.6210721, 19.3885953, 17.29371421, 13.85368756, 15.59018781, 
    14.81984326, 41.64842461, 16.29394917, 14.7150582, 21.12155266, 
    15.81993475, 11.78606019, 14.1812477, 11.70589836, 14.6093647, 
    15.21199958), Si = c(21.16836701, 10.10779796, 15.34477311, 
    18.55455665, 14.33326026, 15.76035258, 5.665395745, 5.775772135, 
    15.50099702, 8.054620606, 26.59536241, 13.85935577, 12.58568469, 
    18.7485275, 20.28945667, 6.650252061, 13.83863564, 7.741041704, 
    10.27977138, 9.224247111), S = c(205.4330401, 57.11209582, 
    93.85434886, 100.70889, 58.09909663, 40.44801629, 30.18807909, 
    45.30207695, 23.9134537, 30.28300595, 33.88869256, 45.03864953, 
    59.74444561, 39.75414202, 20.63363293, 14.07988915, 28.43671918, 
    77.72186352, 22.08674507, 35.25044782)), class = "data.frame", row.names = c(NA, 
-20L))
  1. when I used the ggplot to produce boxplot using the following line:
ggplot(data = NC_RSD_ca.m, aes(x= Sample, y=value, group = value)) + geom_boxplot(aes(fill = variable)

the result is just flat lines!

This is the result of the ggplot FLAT LINES

My question is what I have to do to show the boxplot correctly. I'm trying to produce a similar plot as this image: This is a boxplot from a paper by Gregory et al., 2019
your help is appreciated, and thank you in advance.

dc37
  • 15,840
  • 4
  • 15
  • 32
Majed86
  • 370
  • 5
  • 13
  • 3
    Why did you add `group = value` in your `aes` ? I think this is part of the problem. – RoB Dec 17 '19 at 17:06
  • I tried everything Sample and value it shows only flat line but when using group by variable is just show me one big boxplot. – Majed86 Dec 17 '19 at 17:13
  • If you want more help, you should consider providing a reproducible example of your dataset (https://stackoverflow.com/questions/5963269/how-to-make-a-great-r-reproducible-example). – dc37 Dec 17 '19 at 17:14
  • I will include the data set example – Majed86 Dec 17 '19 at 17:22
  • 2
    It's hard to be sure without seeing more of your data, but it looks like there's only a single row of data for each level of `Sample`. As a result, the quartiles, whiskers and median are all the same value, and the "boxplot" is squished to a single horizontal line located at the single value of `value`. – eipi10 Dec 17 '19 at 17:24
  • I have added a data example . – Majed86 Dec 17 '19 at 17:39

1 Answers1

4

Your data sample has measurements for three different elements. If you reshape to long format, you can get a boxplot for each Sample as follows:

library(tidyverse)
theme_set(theme_classic())

# Reshape (melt) data to long format and set ordering of Sample
 dat.long = NC_RSD_ca.m %>% 
  gather(variable, value, -Sample) %>% 
  mutate(Sample = factor(Sample, levels=unique(Sample)))

ggplot(dat.long, aes(x= Sample, y=value)) + 
  geom_boxplot()

enter image description here

Each boxplot shows the distribution of three measurements, one for each of the original element columns (Al, Si, and S) that we stacked into long format.

If we add fill=variable or colour=variable we get flat lines, because there is only one value (one row of data) for each each combination of Sample and variable. A boxplot of a single value will appear as a flat line, since all of the boxplots statistics (median, quartiles, and 1.5*IQR) will all be equal to that single value.

ggplot(dat.long, aes(x= Sample, y=value, fill=variable, colour=variable)) + 
  geom_boxplot()

enter image description here

For an additional illustration, try running the following examples in the console (geom_boxplot uses the boxplot.stats function to calculate the locations of box and whiskers for the plot). Note that all of the stats in the second example are equal to 1.5.

boxplot.stats(c(1,1.2,1.5,1.8,1.9,8))
boxplot.stats(1.5)  

boxplot(c(1,1.2,1.5,1.8,1.9,2))
boxplot(1.5)
eipi10
  • 91,525
  • 24
  • 209
  • 285
  • So this is working if I want to plot all the elements, but if I tried to plot one element it shows flat lines. – Majed86 Dec 17 '19 at 17:48
  • 2
    Yes, a boxplot of a single measurement will be a flat line because the median, quartiles and other distribution statistics of a single number will all be equal to that number. I've added some additional information about this to my answer. – eipi10 Dec 17 '19 at 17:50
  • I see. but in case I want to plot more elements (around 10) using your answer it again shows flat lines, is that because of the same issue? – Majed86 Dec 17 '19 at 17:58
  • 1
    If you set up the plot in such a way that there's only one row of data per boxplot, then you will get a flat line. In the examples in my answer, so long as there's only one row of data for each combination of `Sample` and `variable`, the first plot will give boxplots for each `Sample` whether you have 3 or 10 elements (or any number of elements more than 1). The second will give flat lines no matter how many different elements you have. – eipi10 Dec 17 '19 at 18:03
  • Ok. thank a lot. but now I'm wondering how they were able to plot their graph (from the last image in my question) as you can see in that image they plot one element concentration in every sample. – Majed86 Dec 17 '19 at 18:06
  • Do they have multiple measurements of each element for each sample? – eipi10 Dec 17 '19 at 18:15
  • to be honest I'm not sure. but I will take a look again to understand what they have did. Thank you very much. – Majed86 Dec 17 '19 at 18:28