0

I am working on R inbuilt dataset airquality and its column Wind. I have removed the NA values and I would like to get a boxplot, which should show outliers and their values next to it. I could not find how to add values anywhere in the forums and as it is one column I am working it, there is nothing similar. I have used this:

dataset3<-data1$Wind
qplot(y=dataset3,geom='boxplot')

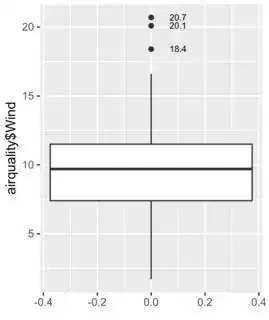
It produces a boxplot, shows that there are three outliers, but does not include their values next to the points. enter image description here
  • Possible duplicate of this question: https://stackoverflow.com/questions/33524669/labeling-outliers-of-boxplots-in-r?rq=1 – ThetaFC Dec 20 '19 at 18:58

1 Answers1

1

Something like this? I guess you have to use the basic boxplot function to get outlier points:

library(datasets)
library(ggplot2)
a=boxplot(airquality$Wind,plot=FALSE)
qplot(y=airquality$Wind,geom='boxplot')+
annotate(geom="text",x=rep(0.1,length(a$out)),
y=a$out,label=a$out,size=2.5)

enter image description here

StupidWolf
  • 45,075
  • 17
  • 40
  • 72