2

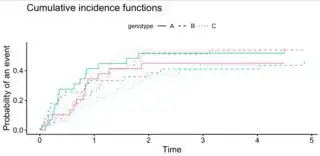
I have made a cumulative incidence plot using cmprsk::cuminc and then ggcompetingrisks for plotting. I want to change legend labels for the group. I've tried with legend.lab = c("A", "B", "C"). This works when I do a ggsurvplot without competing risk. But it does not work now. Any suggestions?

My code is like:

    fit <- cuminc(df$Time, df$Event, group = df$genotype)

    p <- ggcompetingrisks(fit, multiple_panels = FALSE, palette = "black",
                          legend.title = c("genotype"),
                          legend.labs = c("A", "B", "C"))

The thing is that the legend show both the Event (0, 1) and the Group (1, 2, 3). I want only the group to be shown in the legend and I want it to be named A, B and C..

Please help me!!
TobiO
  • 1,335
  • 1
  • 9
  • 24
  • 1
    Welcome! Please add some example data and also tell us, which packages you are using. I guess it's `survminer` See also "How to make a great R reproducible example https://stackoverflow.com/a/5963610/1842673 – TobiO Dec 27 '19 at 15:26

1 Answers1

2

If I get your fit correct, group will be plotted as linetype so you can use scale_linetype_manual() to set the title of the legend, and the names. To turn of the other legend about event, you can use guides()

See below for an example using some simulated data:

library(survminer)
library(ggplot2)
library(cmprsk)

df = data.frame(
Time = rexp(100),
genotype = factor(sample(1:3,100,replace=TRUE)),
Event = factor(sample(0:1,100,replace=TRUE),0:1,c('no event', 'death'))
)

fit <- cuminc(df$Time, df$Event, group = df$genotype)

ggcompetingrisks(fit)
p <- ggcompetingrisks(fit, multiple_panels = FALSE)

p + scale_linetype_manual(name="genotype",values=1:3,labels=c("A","B","C"))+
guides(col="none")

Please do dput(df) and paste the output as part of your question if the df I have above is different from yours. This way others can help as well.

If you need thicker lines, do:

old_geom <- ggplot2:::check_subclass("line", "Geom")$default_aes
update_geom_defaults("line", list(size = 1.5))
p + scale_linetype_manual(name="genotype",values=1:3,labels=c("A","B","C"))+
    guides(col="none")
update_geom_defaults("line", list(size = old_geom$size))

enter image description here

StupidWolf
  • 45,075
  • 17
  • 40
  • 72
  • Thanks you very much! It works and was really helpful. My data.frame is similar to yours just much bigger.. I've alo tried to change the size (thickness) of the lines without succes. Now I tried to change the size with this scale_linetype_manual() like this: p + scale_linetype_manual(name="genotype",values=1:3,labels=c("A","B","C"), size = 1.5) + guides(col="none"). But it does not work. Can you please help me with this one as well? THANKS! – Maria Schou Ebbesen Dec 30 '19 at 07:47
  • hi @MariaSchouEbbesen, see my edited answer above.. I am afraid you have to change the default.. – StupidWolf Dec 30 '19 at 08:58