You can use the following code
#Loading the required packges
library(WDI)
library(tidyverse)
library(maptools)
library("ggplot2")
library("sf")
#Downloading the data
literacy_globe <- WDI(country = "all", indicator = "SE.ADT.LITR.ZS", start = 2015, end = 2018, extra = TRUE)
#Removing the NAs
literacy_globe_1 <- na.omit(literacy_globe)
#Saving the data as .csv file as your data contains blank cells which are not NAs
write.csv(literacy_globe_1, "literacy_globe_1.csv")
#Reading the data from .csv file
data <- read.csv("literacy_globe_1.csv")
#Removing the NAs
literacy_globe <- na.omit(data)
summary(literacy_globe)
head(literacy_globe,2)
#Mapping using ggplot2 package
data(wrld_simpl)
#sp to sf conversion
world <- st_as_sf(wrld_simpl)
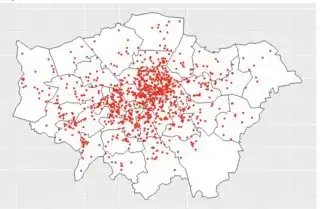
# now create the map
ggplot(world) +
geom_sf(colour = "black", fill = NA) + coord_sf(expand = FALSE) +
theme_bw() + geom_point(aes(longitude, latitude),data= literacy_globe, colour=alpha("red",0.7))

For white fill of polygon and grey outside area, you can use
ggplot(world) +
  geom_sf(colour = "black", fill = "white") + coord_sf(expand = FALSE) +
  geom_point(aes(longitude, latitude),data= literacy_globe, colour=alpha("red",0.7))

Update
choropleth map
literacy_globe <- WDI(country = "all", indicator = "SE.ADT.LITR.ZS", start = 2015, end = 2018, extra = TRUE)

literacy_globe <- na.omit(literacy_globe)
summary(literacy_globe)
head(literacy_globe,2)

#Using ggplot2 package
data(wrld_simpl)

#fortify shape file to get into dataframe
wrld_simpl.f <- fortify(wrld_simpl, region = "NAME")
class(wrld_simpl.f)

head(wrld_simpl.f)

#merge with coefficients and reorder
merge.shp<-merge(wrld_simpl.f,literacy_globe, by.x = "id", by.y = "country", all.x=TRUE)
final.plot<-merge.shp[order(merge.shp$order), ]

head(final.plot, 2)
#basic plot
ggplot() +
  geom_polygon(data = final.plot,
               aes(x = long, y = lat, group = group, fill = income),
               color = "black", size = 0.25)