I'm trying to plot a wave function over one dimension but it has real and imaginary parts, so I did a 3D plot animation of it. This is a screenshot:
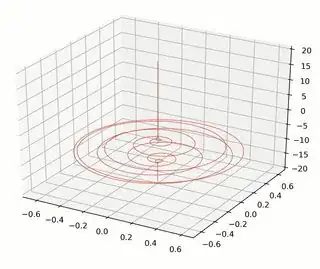
The main thing I would like to do is to spread it along the x-axis (which now is vertical) so it doesn't look squeezed. Also, it would be nice to set it up in a set of 3 RGB axes that intersect at the point (0,0,0). In the documentation I couldn't find any straight forward way to do this. I'm attaching the part of the code I'm using to animate it:
import matplotlib.pyplot as plt
import matplotlib.animation as animation
import mpl_toolkits.mplot3d.axes3d as p3

fig = plt.figure()
ax = fig.gca(projection='3d')
line, = ax.plot(REAL[0,:],IMAG[0,:],x,"r",linewidth=0.5)

def animacio(i):
    ax.collections.clear()
    line.set_data(REAL[i,:],IMAG[i,:])
    line.set_3d_properties(x, 'z')
    return line,

ani = animation.FuncAnimation(fig,animacio,interval=50, frames=Nt,repeat=True)
nom = 'Evolució_'
ani.save(str(nom)+'['+str(V0)+','+str(L)+','+str(l)+','+str(xi)+','+str(sigmax)+','+str(T)+']'+'.mp4', writer="ffmpeg", dpi=300)
plt.show()

print('Animation saved as: '+str(nom)+'['+str(V0)+','+str(L)+','+str(l)+','+str(xi)+','+str(sigmax)+','+str(T)+']'+'.mp4')
