0

Is it possible to rename factor's in a spineplot? The names of my factors are to long, so they overlap.

Thanks for your advices!

Marek
  • 49,472
  • 15
  • 99
  • 121
user734124
  • 489
  • 8
  • 20
  • 1
    Could you please add a reproducible example? See : http://stackoverflow.com/questions/5963269/how-to-make-a-great-r-reproducible-example – Joris Meys May 11 '11 at 11:53

1 Answers1

2

Reading the help for spineplot, it is clear that you can pass the parameters yaxlabels and xaxlabels to control the vectors for annotation of the axes.

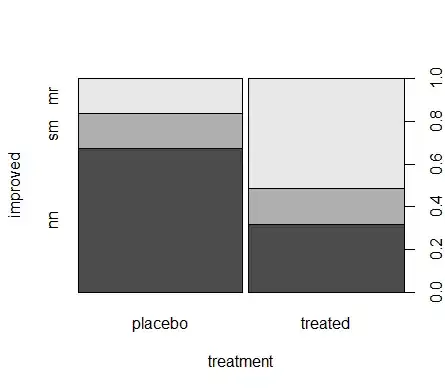
One useful function is abbreviate which will shorten character strings.

Combining this information with the spineplot example gives:

treatment <- factor(rep(c(1, 2), c(43, 41)), levels = c(1, 2),
    labels = c("placebo", "treated"))
improved <- factor(rep(c(1, 2, 3, 1, 2, 3), c(29, 7, 7, 13, 7, 21)),
    levels = c(1, 2, 3),
    labels = c("none", "some", "marked"))

spineplot(improved ~ treatment, yaxlabels=abbreviate(levels(improved), 2))

enter image description here

Not all of the plot functions in R have this type of parameter. For a more general solution, it might be necessary to rename the factors before passing to a plot function. You can access and modify factor names using the levels function:

levels(treatment) <- abbreviate(levels(treatment), 5)
plot(improved ~ treatment)

enter image description here

Andrie
  • 176,377
  • 47
  • 447
  • 496
  • Hey Andrie! Thanks for your thoughts. I extended your example to exactly the problem that I've got. The extended version of your code might be `numberofdrugs<-rpois(84, 2)` `xtabs(numberofdrugs~improved+treatment)` `plot(xtabs(numberofdrugs~improved+treatment))` .So this is not exactly a spineplot, it is a visualization of a contingency table :) Sorry, I thought this is the same. How can I adjust the the labels in this kind of plot? `yaxlabels` doesn't work – user734124 May 11 '11 at 15:49
  • @user734124 I'm glad that helped. Now please start to accept some of the answers you have received. – Andrie May 11 '11 at 15:53
  • Hmm I don't know what you mean.... `plot(xtabs(numberofdrugs~improved+treatment),yaxlabels=abbreviate(levels(improved), 2))` doesn't work when it's not a spineplot! Sorry for bothering you. – user734124 May 11 '11 at 16:46
  • OK. I have modified my answer. – Andrie May 11 '11 at 19:47
  • Thank you! Unfortunately the Labels are above the plot (not as in your example in the spineplot) :( So it seems that R is putting the labels above the plot, when plotting a contingency table. Is there a way to say R to put the Labels below the plot? – user734124 May 12 '11 at 17:30
  • Anything is possible in R. But this sounds like a different question. It depends on the type of plot you are using. Post a new question, this time with some example data and code, and someone is bound to answer. – Andrie May 12 '11 at 17:36